
How to Stress Test Cloud Phone Performance: Synchronized Monitoring of CPU, Memory, GPU Usage and Frame Rate
Why Cloud Phones Need Performance Stress Testing
Many users assume that because a cloud phone runs in a provider's data center, its performance is fixed and nothing to worry about. In reality, a cloud phone is a virtualized Android environment running on servers, where CPU, memory and GPU resources are dynamically allocated by the host machine. When you run multiple games, automation scripts or other sustained heavy workloads at the same time, resource contention quickly turns into frame drops, stuttering and app crashes.
The whole point of stress testing is to expose these risks under controlled high load before you scale up, and to make sure your monitoring data can answer one critical question: where exactly is the bottleneck?
The Four Core Metrics: What to Watch and What Counts as Healthy
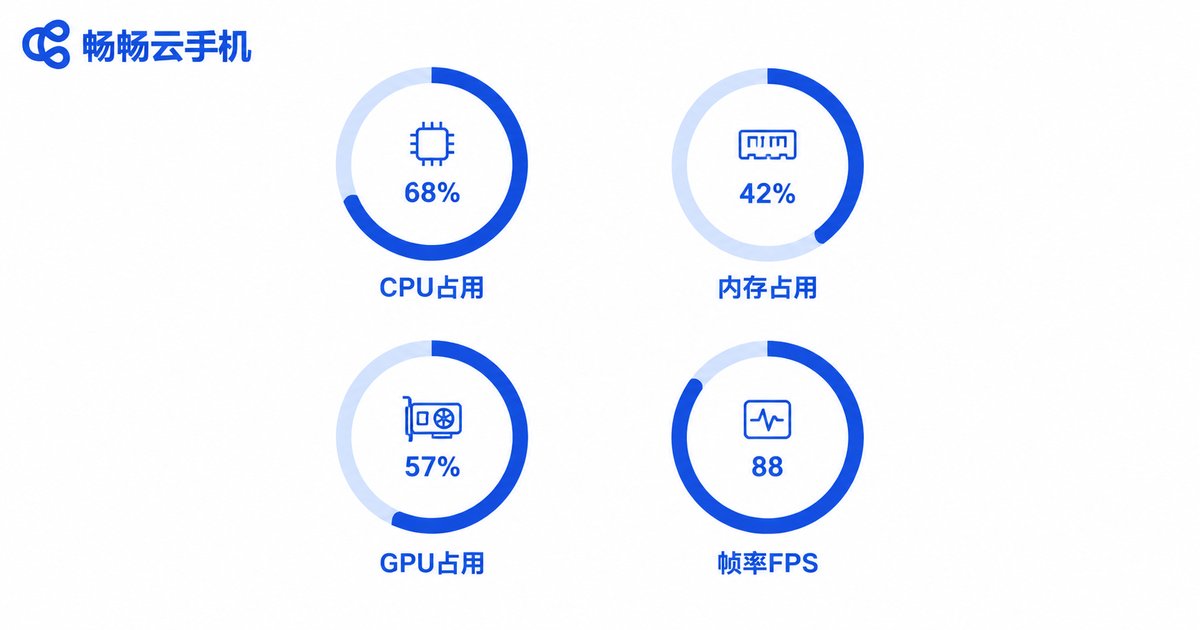
Stress testing is not about running a benchmark once. It is about watching how four metrics evolve under load:
CPU usage: watch overall load, but watch single-core saturation even more. Much of Android app logic runs on the main thread, so a single pegged core is far more damaging than a high overall average.
Memory: watch the app's PSS (actual physical memory) and the system's available memory. When free memory stays low for long, the low memory killer (LMK) starts terminating background apps, which shows up as apps being killed and reloading.
GPU usage: in high-quality games and heavy rendering scenes the GPU is usually the first bottleneck, with usage pinned near 100% while the frame rate refuses to rise.
Frame rate (FPS): never judge by the average alone. Jitter and jank counts define the real experience: an average of 60 FPS with frequent dips to 30 feels far worse than a stable 50.
| Metric | What to watch | Reference health line |
|---|---|---|
| CPU | Single-core saturation, system process share | Below 85% under sustained load |
| Memory | Available memory, LMK events | Free memory above 20% of total |
| GPU | Whether usage and FPS move together | Not pinned at 100% for long |
| Frame rate | Average, jitter, jank count | Fluctuation within 15% of the average |
The Key to Synchronized Monitoring: One Timeline for All Four Streams
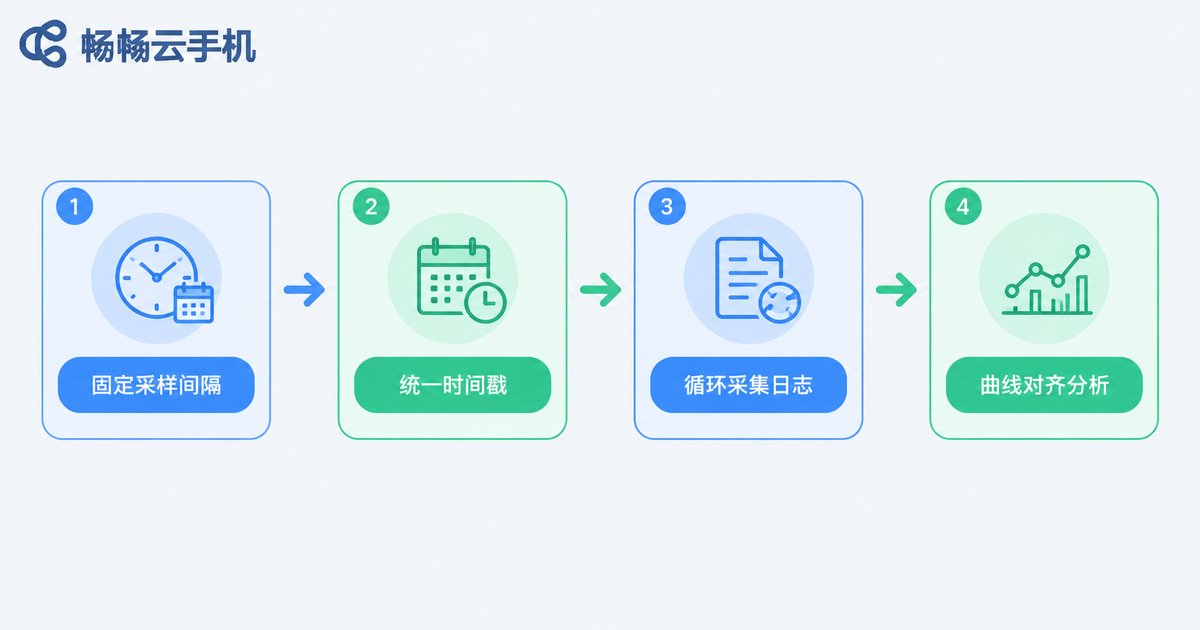
Checking CPU in one screenshot and FPS in another makes it impossible to answer what the CPU was doing during that exact second of frame drop. Synchronized monitoring comes down to two things: one fixed sampling interval and one shared time base.
1. Fix the sampling interval: once per second for the entire run, with no changes midway.
2. Stamp every sample with its capture time.
3. Afterwards, plot all four curves on the same chart and inspect what the other metrics were doing at the moment of each frame drop.
Hands-on: A Set of Copy-paste Sampling Commands
If your cloud phone supports ADB debugging, the following command combination covers all four metrics:
# CPU usage: top 10 processes, 1-second interval
adb shell top -m 10 -d 1 -n 1

# Memory details: PSS and available memory
adb shell dumpsys meminfo your.package.name

# Frame timing and rendering stats (enable GPU render profiling first)
adb shell dumpsys gfxinfo your.package.name framestats

# GPU busy ratio (Qualcomm devices, where available)
adb shell cat /sys/class/kgsl/kgsl/gpubusy
Wrap these commands in a loop script that appends every result to a log file with a timestamp. After the test, import the log into a spreadsheet and plot the four curves side by side, and the bottleneck becomes obvious at a glance.
Designing the Test: Four Typical Load Scenarios
| Scenario | How to run it | What it validates |
|---|---|---|
| Single-app extreme | 2 hours of a demanding game at maximum settings | Stability under sustained heavy load |
| Multi-app concurrency | 3 to 5 apps running and switching simultaneously | Scheduling under resource contention |
| Long soak test | 8+ hours of scripted idle farming | Memory leaks and thermal throttling |
| Burst load | Repeated cold starts of a heavy app | Speed of resource allocation |
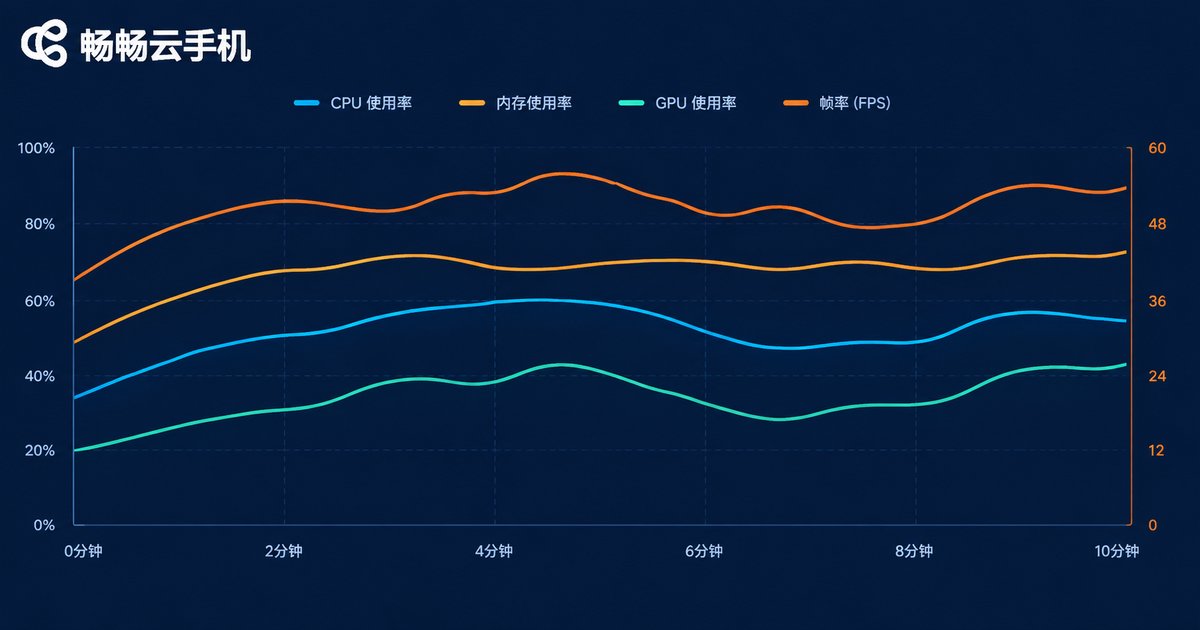
Reading the Data: From Symptom to Bottleneck
| Symptom | Likely bottleneck | What to do |
|---|---|---|
| Frame drops with a pegged single core | CPU shortage or thread scheduling | Lower graphics settings or fewer instances |
| Gradual FPS decay with shrinking free memory | Memory leak | Restart the app or instance periodically |
| GPU pinned while FPS stays low | GPU rendering bottleneck | Reduce resolution and effect levels |
| All metrics moderate yet still stuttering | Network latency or streaming bottleneck | Check the network path and bitrate settings |

Choose a Cloud Phone Platform That Survives Testing
Accurate results depend heavily on the stability of the cloud phone platform itself. If a provider oversells resources and scheduling fluctuates, measurement noise will drown out real problems. ChangChang Cloud Phone (ccloudphone) delivers a cloud-based Android environment with centralized multi-instance management and zero local device usage, making it a solid fit for teams that need to validate app behavior in batch: run your stress scripts on cloud instances and handle both data collection and instance management from the same console, free from local device variance. For plans and configurations, visit the official ChangChang Cloud Phone website.
FAQ
Q: How is cloud phone stress testing different from testing on a physical device?
A cloud phone adds encoding and video streaming on top of the app itself, so beyond app performance you should also record input response latency during the test for a complete picture.
Q: Can I still monitor without ADB access?
Yes. Use the in-game FPS overlay for frame rate and the cloud phone console resource panel for CPU and memory. Precision is lower, but it is enough for qualitative judgment.
Q: How long should a stress test run to be meaningful?
Two hours at minimum to verify stability, and eight to twenty-four hours to expose memory leaks and thermal throttling. The longer the run, the closer the data is to real long-term usage.
Q: Does a fluctuating frame rate always mean insufficient performance?
Not necessarily. Network jitter, streaming congestion and server scheduling can all cause it. Always cross-check CPU and GPU data on the same timeline before drawing conclusions.