Cloud Phone Remote Real-Device Debugging: How Breakpoints, Variable Inspection, and Hot Reload Work in the Cloud
Why Developers Are Moving Real-Device Debugging to the Cloud
Android developers know it well: no matter how fast emulators get, many issues only surface on real devices — vendor ROM differences, sensor behavior, push notifications, camera permissions. But local device debugging has its own pain points: plugging and unplugging phones, flaky USB cables, and a desk full of devices when you need five models at once.
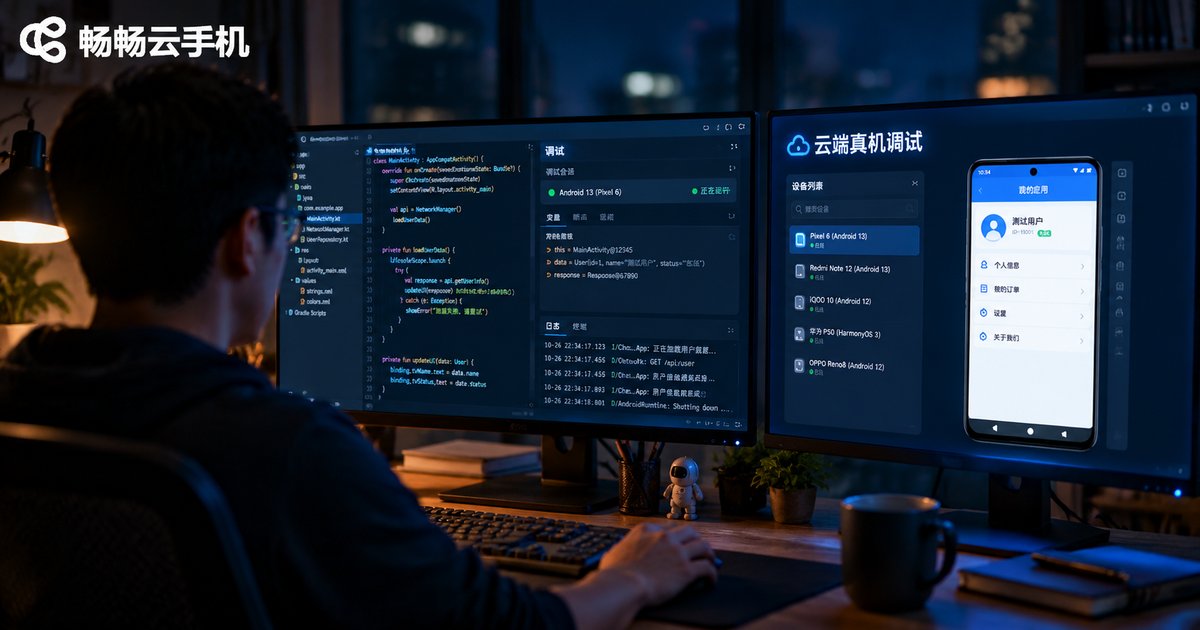
Cloud phones change that. What runs in the cloud is a complete Android system on real hardware, not a simulated environment — you control it through a remote screen as if the phone were on your desk. Better yet, the debugging pipeline moves to the cloud with it: breakpoints, variable inspection, and hot reload all work remotely.
The Core of Cloud Debugging: One Encrypted Tunnel
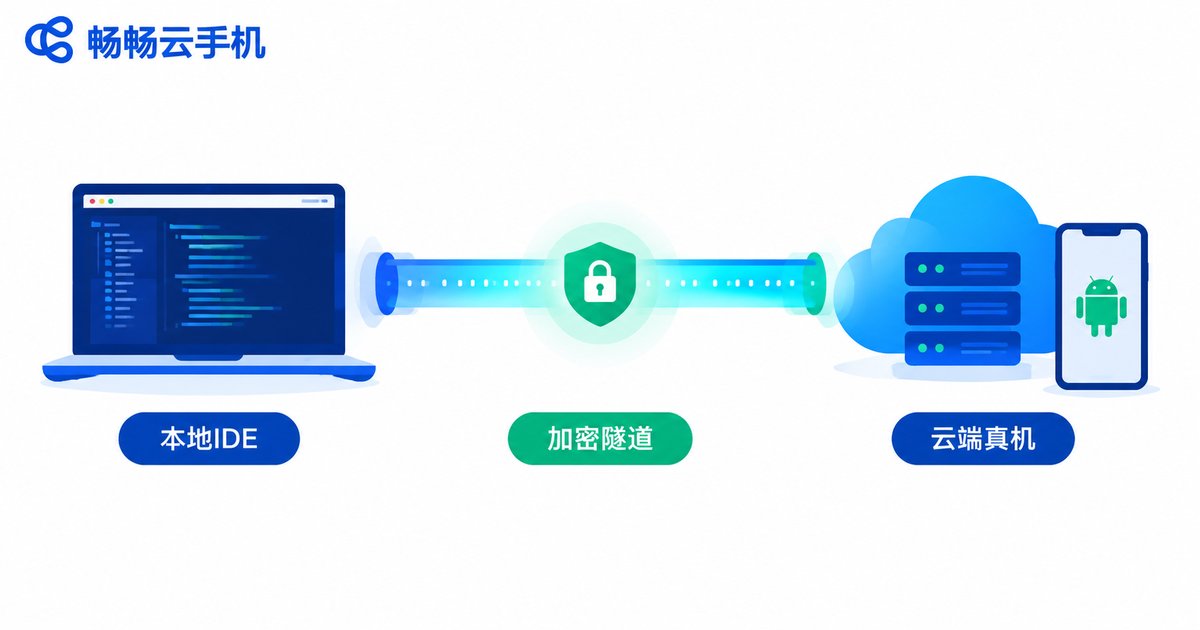
First, the principle. Debugging a device from Android Studio goes through ADB (Android Debug Bridge), which sits on top of the JDWP debug protocol. For a cloud phone to support remote debugging, the trick is to replace the USB cable with a network tunnel:
1. Cloud side: a cloud phone instance is a real Android device running in a data center, with its debug services (adbd/JDWP) working normally;
2. Transport side: the platform maps the debug port through an encrypted tunnel, so once your computer connects, ADB believes the device is plugged in locally;
3. Local side: Android Studio, VS Code, and other tools detect the device as usual — logs, breakpoints, and memory analysis all work unchanged.
# After connecting, the device list shows a remote real device
adb devices
# Example output:
# device-8f3a2c   device
Once the tunnel is up, the debugging experience is nearly identical to a USB-connected phone — because to the IDE, it simply is a standard Android device.
Breakpoints: Set and Hit Them on a Cloud Device
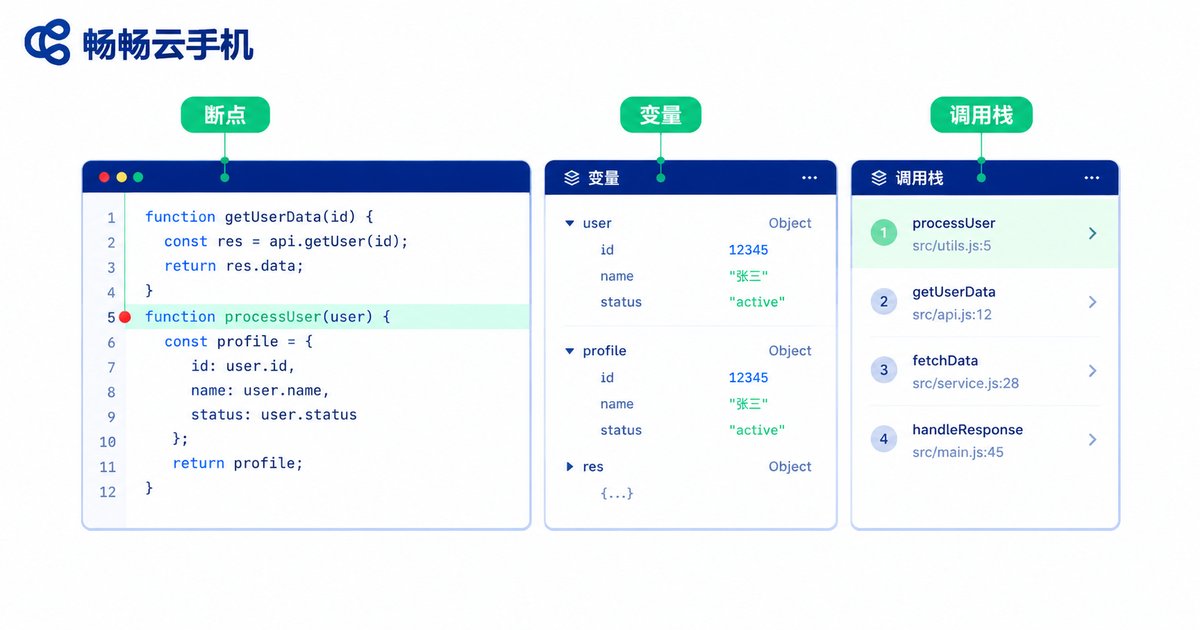
A breakpoint works like this: the IDE tells the target process, over the debug protocol, to suspend at a given line, and the thread state is sent back once it stops. Nothing here depends on where the device physically sits — only on whether the debug link is stable.
What setting breakpoints on a cloud phone feels like:
1. Set the breakpoint: click a line number in Android Studio and the marker appears as usual;
2. Hit the breakpoint: interact with the app on the remote screen (tap, swipe — anything), and when execution reaches that line, the IDE switches to the debug view;
3. Step through: Step Over, Step Into, and Resume all work, and the app on the remote screen freezes and resumes in sync.
The only thing to watch is network latency: hitting and resuming a breakpoint adds tens to a few hundred milliseconds of transport overhead — imperceptible on a normal office network. If it feels slow, check the network path between you and the cloud region first, not the breakpoint feature itself.
Variable Inspection: Watch Your Data as Closely as Local
Once a breakpoint hits, what matters most is seeing the scene — and cloud debugging loses nothing here:
· Variables panel: locals and fields of the current frame in real time, with objects expandable level by level;
· Watch expressions: add watches that re-evaluate on every step;
· Call stack: full thread stacks, frame by frame, to retrace how you got here;
· Expression evaluation: Evaluate Expression runs a snippet right at the breakpoint to test a hypothesis.
For hard-to-reproduce issues, here is a particularly effective trick: dedicate one cloud phone instance as a reproduction device, plant breakpoints and watches along the suspicious path, and let testers or automation scripts hammer it in the cloud while you watch the variables in your IDE. The device never occupies your desk, and when the bug shows up, all the data is already captured.
Hot Reload: Change Code, See It on the Cloud Device in Seconds
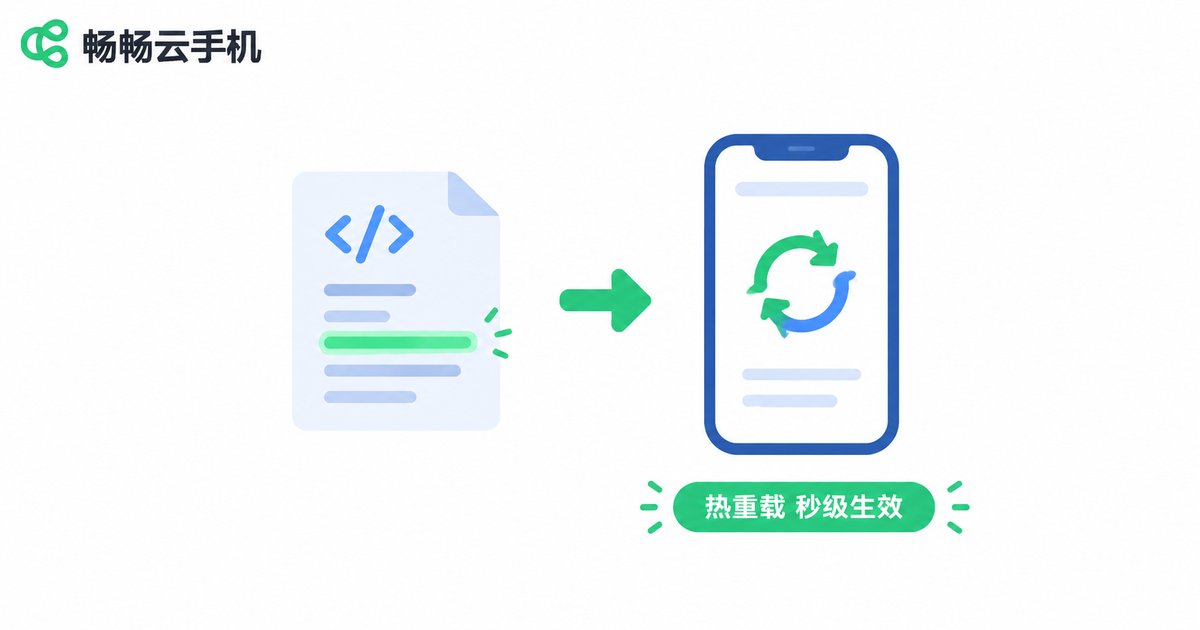
Hot reload is the ultimate UI productivity booster: edit a layout or a style and the screen refreshes without reinstalling the app. Flutter, React Native, and similar frameworks all support it — and their reload channels already run over the network, which means cloud devices are naturally compatible.
Take Flutter as an example:
# With the cloud phone connected, start a debug session as usual
flutter run
# Press r for hot reload, R for hot restart
# Changes are pushed to the cloud device over the debug channel; the UI refreshes instantly
Hot reload payloads are tiny (only changed code fragments and assets), so even over a cloud link the refresh speed is essentially the same as local. The real thing to watch is state preservation: hot reload does not reset app state, so if you changed initialization logic, verify with a hot restart.
Local Device vs Cloud Phone Debugging: A Quick Comparison
| Dimension | Local device | Cloud phone |
|---|---|---|
| Getting devices | Buy every model you need | Start instances on demand |
| Parallel testing | Limited by USB ports and desk space | Multiple instances in parallel |
| Breakpoints and variables | Full support | Full support, identical experience |
| Hot reload speed | Fast | Near-local, network dependent |
| Team sharing | One device, one person at a time | Cloud instances shareable across the team |
| Environment consistency | Every phone differs | Uniform images, reproducible environments |
A Practical Workflow with ChangChang Cloud Phone
To try this on a real project, we recommend ChangChang Cloud Phone (ccloudphone). The overall approach:
Step 1: create an instance on ChangChang Cloud Phone with an Android version matching your target users;
Step 2: install the app under test on the instance and confirm it runs via the remote screen;
Step 3: following the platform's debugging integration guide, add the cloud phone to your local toolchain's device list;
Step 4: set breakpoints, add watches, run hot reload — treat the cloud phone as a real device living in the data center.
For integration details and instance specifications, check the latest documentation on the official ChangChang Cloud Phone website. Keep a few instances mapped to your main test models, pair them with your IDE's multi-device debugging, and a full cloud device lab is up and running.
FAQ
Q: Is cloud phone debugging the same as emulator debugging?
No. An emulator virtualizes Android on your PC and can behave differently from hardware. A cloud phone is a real Android device in a data center that you access remotely — the compatibility issues that appear on real devices appear here too, so your findings are more trustworthy.
Q: The remote screen freezes after a breakpoint hits — is the network broken?
Most likely not; it is expected behavior. The process is suspended, so the remote screen naturally stops updating, and it comes back the moment execution resumes.
Q: Is hot reload noticeably slower in the cloud?
Hot reload transfers very little data, so on a normal network it feels the same as local. If it is slow, check the network path to the cloud region first.
Q: Can I debug several cloud phones at once?
Yes. With multiple instances, your IDE's multi-device debugging works as usual, with breakpoints and logs separated per device — ideal for batch compatibility testing.
Q: Does debugging affect other data on the cloud phone?
Debugging only attaches to the app process being debugged and leaves other apps and data untouched. Still, it is safer to install debug builds on a dedicated testing instance, separate from daily-use instances.