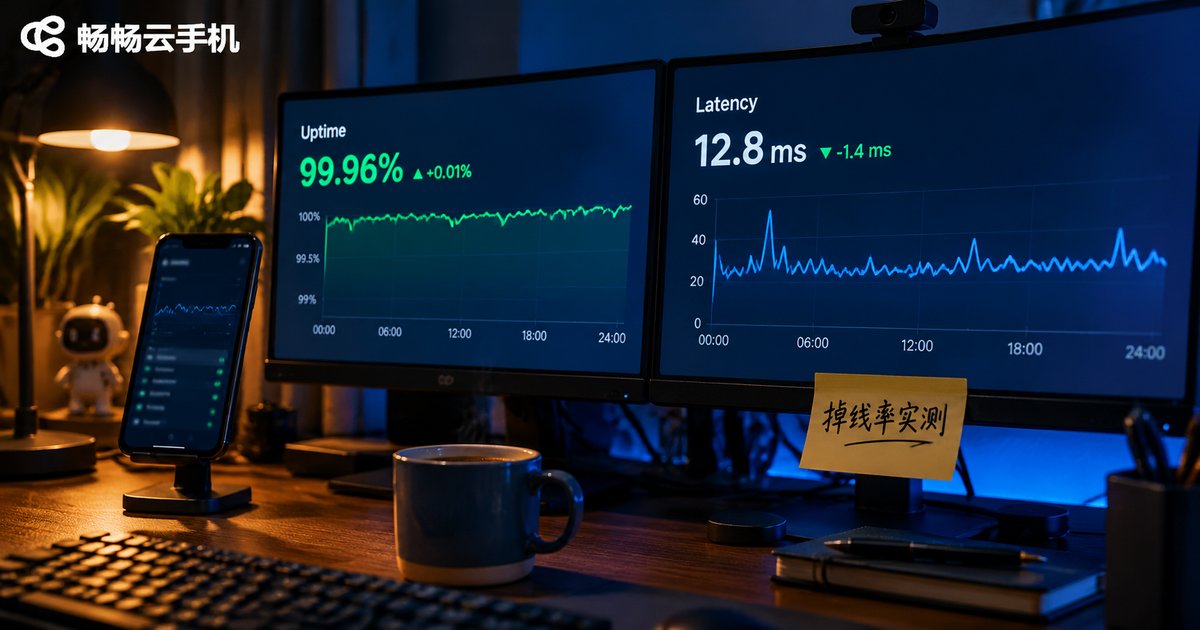

How to Identify Cloud Phone Performance Bottlenecks: Configuration, Network, and Workload Analysis
When a Cloud Phone Slows Down, Do Not Rush to Upgrade
Plenty of people run games, automation scripts, and multiple accounts on cloud phones. The moment frames drop, taps feel delayed, or a task stalls halfway, the instinct is: 'the instance is underpowered, upgrade it.' Reality is usually messier. Cloud phone performance issues come from three very different layers: instance configuration, network link, and task workload. Guess the wrong layer and you end up paying more for a bottleneck that never existed.
The method below needs no special tooling—just the operations already in front of you: split the problem into layers, verify one item at a time, and walk away with a clear conclusion.
Step One: Split 'Lag' into Three Layers
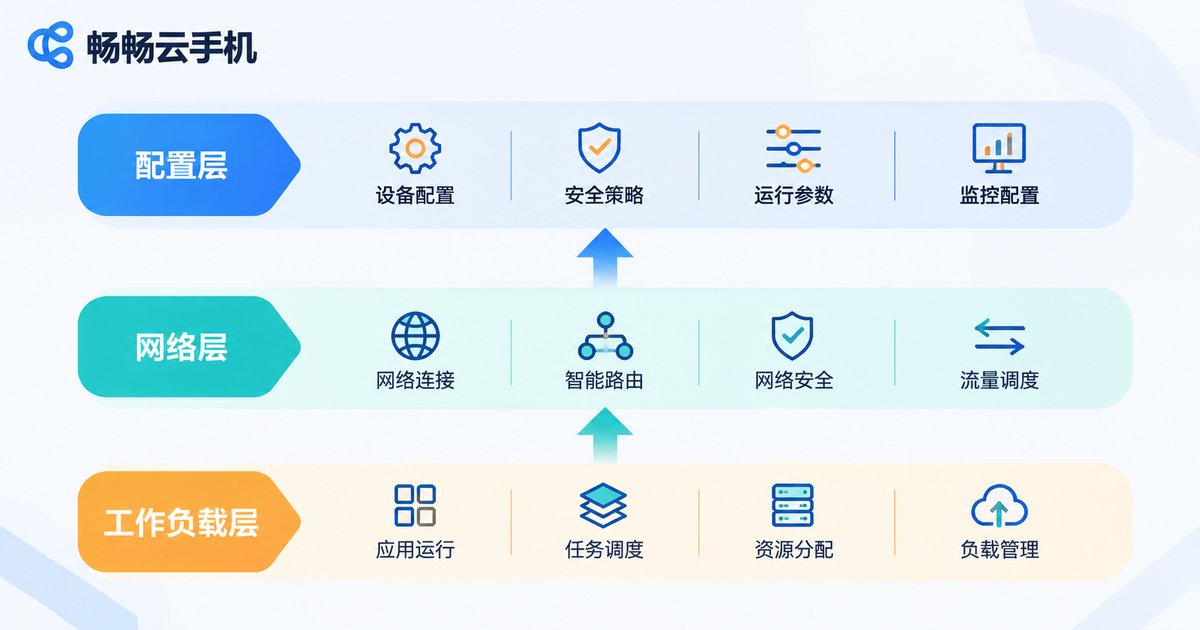
Before touching anything, build a simple framework. A cloud phone session is really a chain: you see a frame on your local device → your input travels over the network to the cloud → the cloud instance executes the task → the resulting frame travels back to your screen. If any segment fails, the user perceives the same single thing: lag.
| Layer | Common triggers | Typical symptoms |
|---|---|---|
| Instance configuration | CPU cores, memory, storage capacity, rendering spec | App crashes, slow loading, persistently low frame rate |
| Network link | Bandwidth, latency, packet loss, jitter, local network conditions | Input feels delayed, blurry frames, occasional disconnects |
| Task workload | Number of instances, script loop frequency, background sync | Fast at first, gradually slowing over time |
Match your symptoms against this table and you usually eliminate most wrong directions immediately.
Step Two: Recognizing a Configuration Bottleneck
Configuration bottlenecks follow a handy rule: they correlate strongly with what you are doing and barely at all with when you are doing it. If the same kind of task lags equally at noon and at midnight, on any network, the configuration layer is the likely culprit.
Watch four signals:
1. Memory pressure. Once available memory is exhausted by multiple apps or a heavy game, the system starts killing background processes—and every time you switch back, the app reloads.
2. Sustained high CPU. The key word is sustained, not spiky. Short spikes are normal; long stretches at high utilization mean the workload has outgrown the instance.
3. Storage full. Logs, caches, screenshots, and recordings pile up and drag down read/write speed—sometimes causing writes to fail outright. This cause is the most overlooked.
4. Resolution and quality set too high. Many users max out resolution for clarity, which sharply increases encoding load and makes the stream less stable. Dropping one notch often beats upgrading the instance.
A quick verification: run the exact same task on a higher-spec instance. Still laggy? The bottleneck is probably not configuration—go look at network and workload.
Step Three: Recognizing a Network Bottleneck
Network bottlenecks behave in the opposite way: they correlate strongly with when and barely at all with what. The same task is fine during the day and stutters during peak evening hours. Or input feels noticeably delayed even though the cloud task finished long ago—only the result is slow to come back.
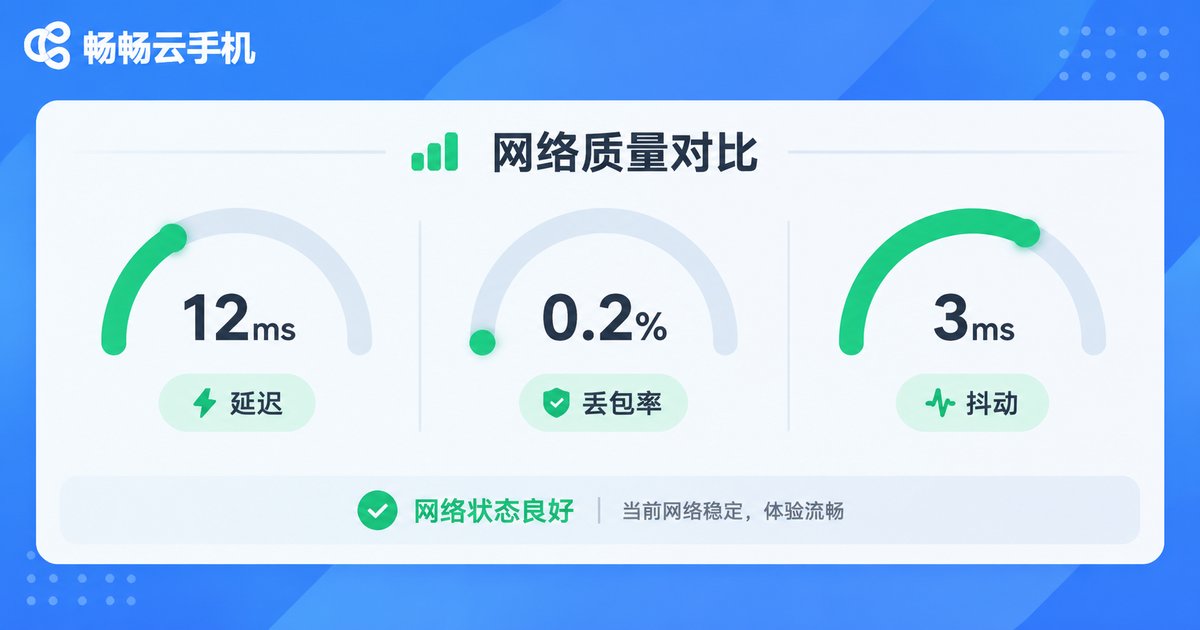
Focus on three metrics:
Latency (round-trip time): how long a request takes to travel there and back. This directly determines how 'attached' your input feels.
Packet loss: the share of data lost in transit. The classic symptom is blocky artifacts, mosaic patches, and localized freezes.
Jitter: latency that swings up and down. The average may look fine, but the constant oscillation feels worse than a stable high latency.
Run three checks: first, switch to a different network path (wireless to wired, or a different carrier environment); second, measure at different times of day to spot a pattern; third, reduce the number of concurrent devices on the same local connection so you are not saturating your own egress.
- Clearly better after switching networks? The link is the problem, not the instance.
- Bad only in certain hours? Suspect peak-hour congestion first.
- High latency but zero packet loss? Likely physical distance or a roundabout route.
Step Four: Recognizing a Workload Bottleneck
Workload bottlenecks are the sneakiest because they masquerade as 'not enough configuration.' Nothing about your instance or network changed—you simply opened two more instances, or doubled your script loop frequency, and everything got slower.
There is one detection method: subtract. Drop from five instances to one and see if smoothness returns. Double the script interval and check whether stutter eases. Turn off high-frequency background actions like auto-sync, auto-screenshot, and auto-recognition, then compare again. If subtracting clearly helps, the bottleneck lives in the workload layer, not in the instance.
Common workload traps: scripts with no sleep interval that hammer the instance continuously; multiple instances sharing one local input channel; long unattended sessions that never clear caches or logs. None of these are cured by buying a bigger instance.
Three Bottlenecks Side by Side
| Observation | Configuration | Network | Workload |
|---|---|---|---|
| Timing | Always laggy | Laggy in specific hours | Worse the longer it runs |
| Relation to task | Strong | Weak | Strong (volume-driven) |
| Visual symptoms | Low frame rate, crashes, slow loads | Artifacts, delay, disconnects | Gradual slowdown, random unresponsiveness |
| After subtracting | No improvement | May improve | Clear improvement |
| Recommended action | Adjust spec or free storage | Change path, shift schedule | Lower concurrency, tune pacing |
Turn Troubleshooting into a Repeatable Routine
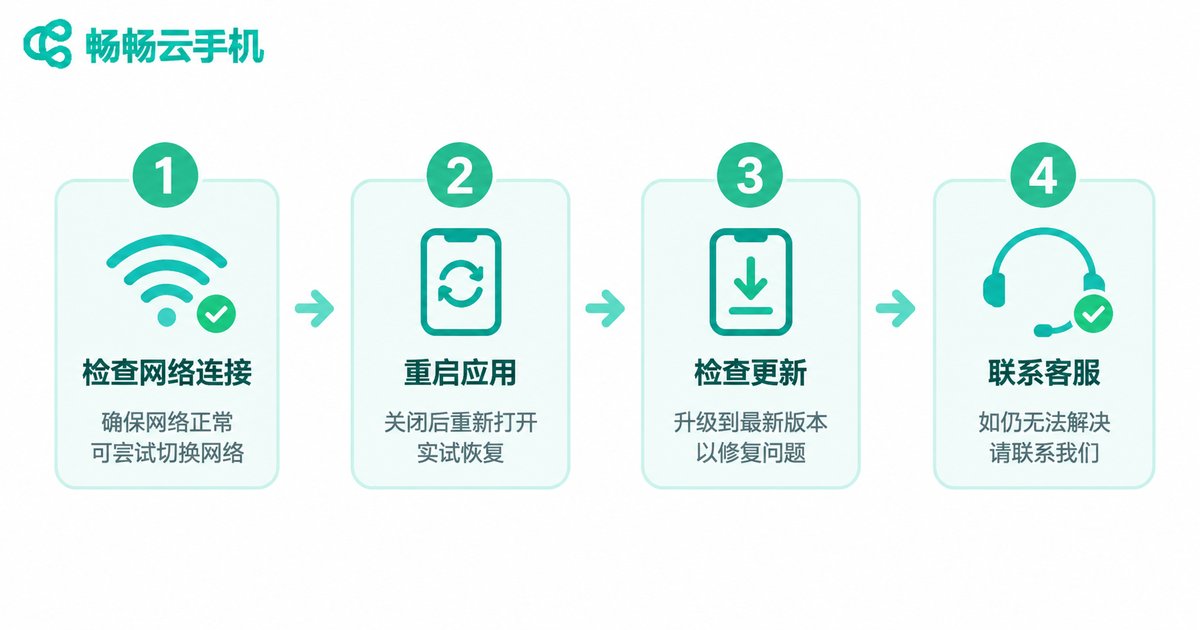
One-off checks rely on intuition; long-term stability relies on process. Lock in these four steps:
1. Record the symptom. Write down when it lags, which action it lags on, and how long it lasts. These three details are worth more than any screenshot.
2. Isolate variables. Change exactly one condition at a time—network, instance, or concurrency—and retest immediately. Never change two at once.
3. Bisect. Compare across half the scenarios first to narrow the range, then close in on the real cause.
4. Freeze a baseline. Write down the combination that runs best: resolution, concurrency, script interval, usage window. When something goes wrong later, compare against the baseline and the anomaly reveals itself fast.
Use a Clean Cloud Environment as a Control
Sometimes the problem is neither configuration nor network, but the state of your local device: too many background processes, a nearly full disk, an outdated system version. The best move then is to compare against a clean cloud environment.
Changchang Cloud Phone (ccloudphone) provides Android instances that run in the cloud and are accessed remotely through a client, supporting parallel instances and long online sessions. Use it like this during troubleshooting: run the same accounts and the same operations once on your local device and once on the cloud phone. If the cloud side is smooth and the local side stutters, the problem is local. If both behave badly, go back and check network and workload. Having a ready-to-use, resettable control environment beats repeated guesswork every time.

Frequently Asked Questions
Q: Does cloud phone lag always mean I need to upgrade?
A: No. Use the three-layer framework first: lag on the same task at any time points to configuration; lag only in specific hours points to network; lag that grows over time points to workload.
Q: How do I quickly separate network issues from configuration issues?
A: Switch to a different network and rerun the same task. Clear improvement means the link is at fault; no change means you should look at configuration and workload.
Q: More instances means more lag—is that a spec problem?
A: Verify by subtracting first. Cut concurrency in half; if smoothness returns noticeably, the workload simply exceeded what the current instance can carry. Lower concurrency or tune the script pacing.
Q: The picture looks sharp but input feels half a beat behind. Why?
A: That is latency and jitter, not image quality. A crisp picture only means bitrate is sufficient—it says nothing about round-trip time. Measure the latency fluctuation.
Q: How often should I run a performance self-check?
A: Whenever the scale of your work changes—after adding instances, swapping scripts, or changing resolution. In between, keep logging symptoms; it saves enormous time when something breaks.