
How to Check Cloud Phone Running Status: Daily Inspection Checklist and Anomaly Diagnosis
Why Cloud Phones Need a Daily Inspection Routine
The biggest difference between a cloud phone and a physical device is that there is no chassis to touch. You cannot hear a fan spin up or feel the back of the phone getting warm. When something goes wrong, users usually only notice the symptoms: the screen stutters for a moment, a tap does nothing, or the session suddenly drops.
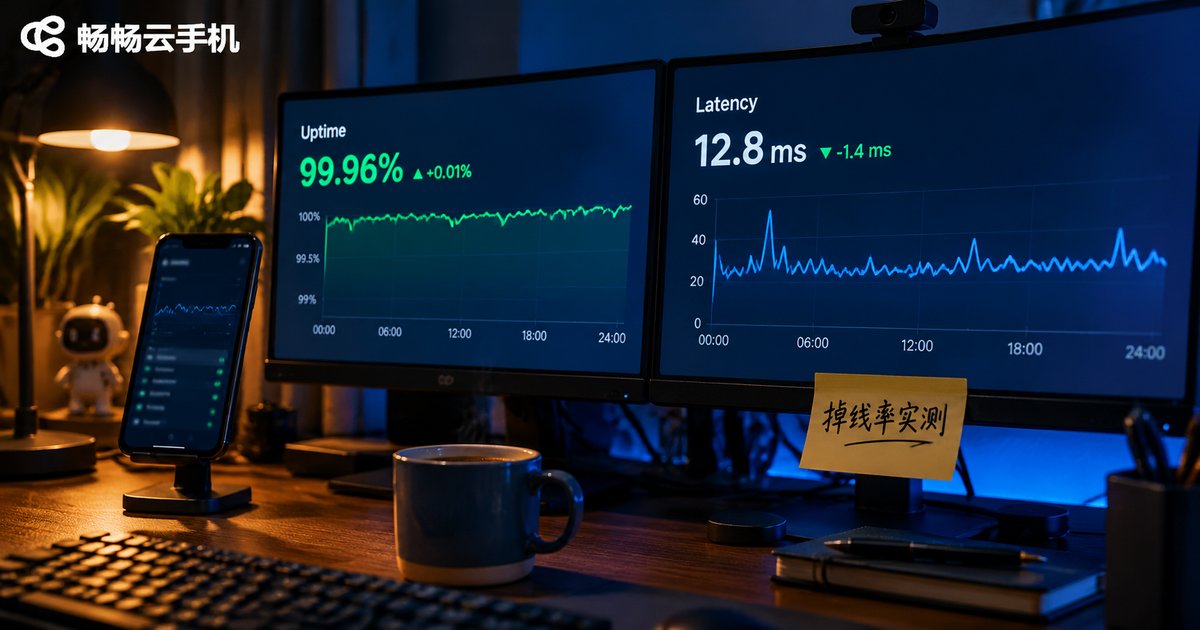
And most cloud phone failures do not happen in an instant. They are慢性 in nature — CPU usage climbs a little, memory only goes up, packet loss quietly creeps from 0.1% to 3%, and then everything surfaces during one busy session.
The point of a daily inspection is to spot the trend before users start complaining. A few minutes of observation each day is usually a far better investment than half an hour of log digging afterwards.
Five Core Metrics: What Your Cloud Phone Is Telling You
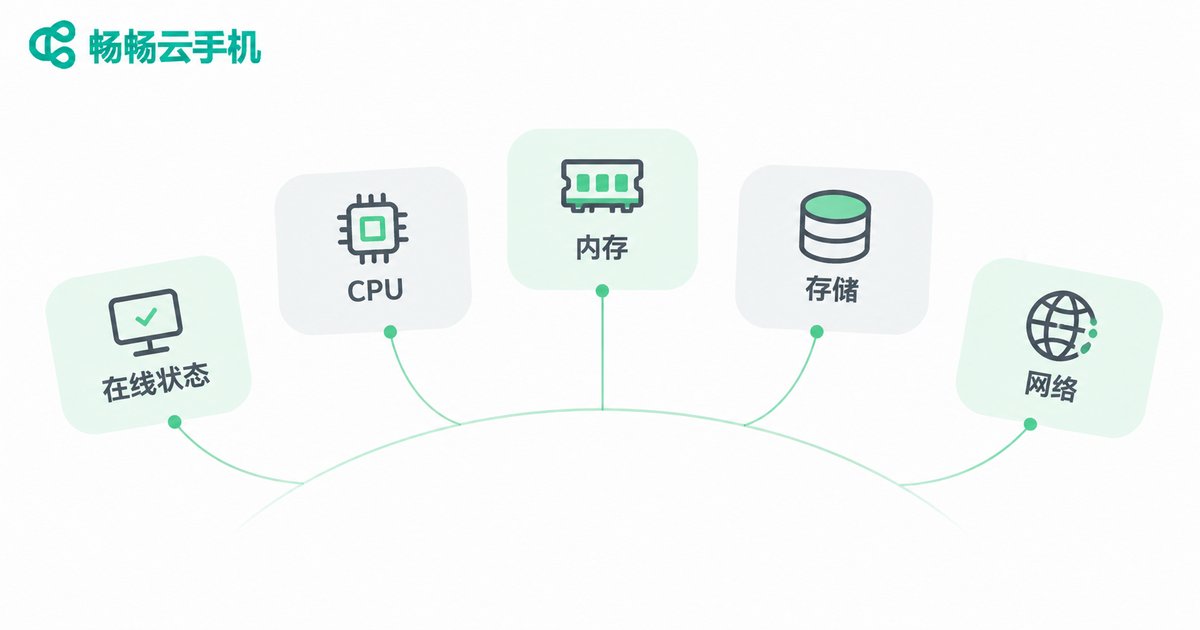
You do not need to be an operations expert. Five metrics cover more than 90% of common cloud phone issues.
- Online status and heartbeat: whether the instance is online and whether the connection is stable. This is the precondition for everything else — when an instance is offline, other metrics mean nothing.
- CPU usage: sustained usage above 80% usually means insufficient compute, showing up as stuttering video, dropped frames and slow app response.
- Memory usage: a healthy pattern rises and falls. If it only climbs and never comes back down, it is likely a memory leak, and a crash is only a matter of time.
- Free storage: below 10% is a warning sign — apps start slower, log writes fail and caches cannot be written to disk.
- Network latency and packet loss: latency determines how the controls feel, while packet loss determines whether the picture breaks up or the session drops entirely.
Read all five together and you can quickly tell whether the problem is compute, memory or network. That is the foundation for every diagnosis below.
The Daily Inspection Checklist: Just Follow It
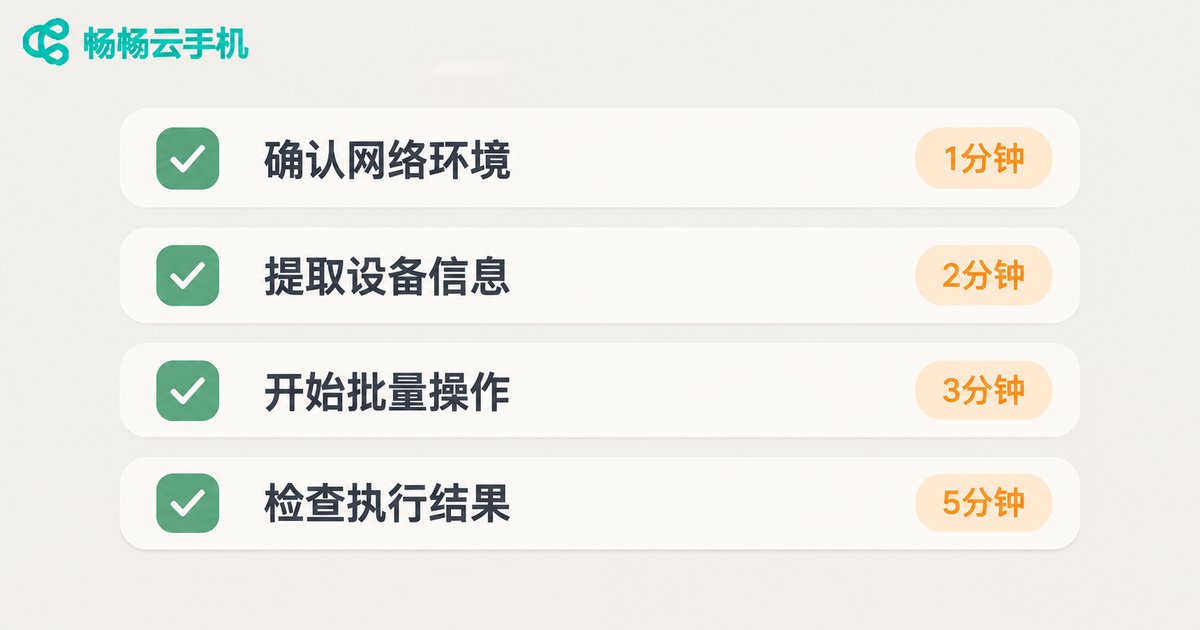
An inspection is not about staring at every metric — it is about layering checks by frequency. The checklist below is organised into three tiers, and you can add or remove items based on fleet size.
| Frequency | Check | Healthy baseline |
|---|---|---|
| Start of shift | Instance online rate, accounts can log in | All online, no unexpected exits |
| Start of shift | Apps launch, picture renders correctly | Launches within expected time, no black or broken screen |
| Every 2 hours | Spot-check CPU and memory | CPU below 80%, memory not trending one way |
| Every 2 hours | Check latency and packet loss | Stable latency, packet loss close to zero |
| Once daily | Free storage | More than 15% free |
| Once weekly | Resource trend curves and alert history review | No persistently worsening trend |
| Once weekly | App versions and system images | Consistent across the same batch of instances |
The most important part of an inspection is not looking — it is writing it down. Keep a simple sheet, even if it only has three columns for CPU, memory and latency. After a week you will start to see trends, and trends are far more useful than single readings.
Diagnosis: Symptom, Likely Cause and First Action
Knowing what to watch is only half the job. The other half is knowing what to do when a reading looks wrong. The table below covers the most common situations.
| Symptom | Likely cause | First action |
|---|---|---|
| Stuttering video, dropped frames | CPU pegged at the limit, insufficient compute | Close high-usage background apps first, then assess whether a larger configuration is needed |
| App crashes repeatedly | Memory hit the ceiling | Restart the app and watch whether memory climbs one-way again |
| Black screen, but instance shows online | Display output or streaming process failure | Reconnect the instance; if that fails, restart it |
| Frequent disconnects | Rising packet loss or local network instability | Verify the local network first, then switch access route or node |
| Controls feel noticeably delayed | Higher network round-trip latency | Compare latency across nodes and prefer the nearest one |
| Apps launch slower over time | Low storage, cache accumulation | Clear caches and unused files to free up space |
| Instance will not boot or restarts often | System fault or resource scheduling failure | Review the instance status message; reinstall or rebuild if necessary |
One practical rule: decide first whether this is a single-instance problem or a batch problem. One instance behaving badly means you look at that instance first. A batch failing at once points to the network path, the image version or the overall resource allocation. Getting this direction right saves a large share of the diagnosis time.
Three Small Habits That Make Inspections Stick
First, fix the inspection time slots. Ten minutes before each shift starts, before the midday break, and before handover. Fixed slots work far better than checking whenever you remember.
Second, set sensible alert thresholds. CPU above 80% for ten straight minutes, memory rising for thirty minutes, or packet loss above 1% are all worth a notification. Do not make thresholds so sensitive that alerts get ignored.
Third, always leave a handover record. Write down what was abnormal, what you did and what happened. Cloud phones run for long stretches, and an anomaly that was never documented tends to be re-diagnosed several times over.

Make Inspections Easier with ccloudphone
If you would rather not click through metrics instance by instance, centralise the routine instead. ccloudphone provides cloud-hosted Android instances that you can access and manage through a web browser or client, with instance running status and resource usage visible in one console, and batch operations across multiple instances without switching between them one by one.
For workloads that need to stay online for long periods, hosting instances in the cloud alongside a fixed inspection rhythm is usually easier to control than maintaining one physical device per task. Available configurations and access methods are documented on the official site — start with a small trial to confirm fit with your own workload.
Frequently Asked Questions
Q: What is the minimum set of metrics to check on a cloud phone?
If you only look at three, check CPU usage, the memory trend and network latency with packet loss. Together they cover most stuttering, crashing and disconnection issues.
Q: Is it normal for CPU usage to jump up and down?
Yes. Short-term fluctuation means resources are being scheduled normally. What matters is usage that sits at the top for long stretches — that is the real signal of insufficient compute.
Q: Does high memory always mean I need a bigger configuration?
Not necessarily. Check whether it rises one-way and never falls back; that looks more like a memory leak, and restarting the app or clearing caches often relieves it. If it fills up again quickly after a restart, then consider changing the configuration.
Q: If only one instance lags, do I need a broad investigation?
No. For a single instance, check its processes, storage and resource usage first. Broad checks of network paths, image versions and overall configuration are for batch failures.
Q: How often should inspections run?
A full inspection at the start of each shift, spot checks of core metrics every two hours, storage once a day, and a weekly trend review. That rhythm is enough for most workloads.
Q: Can I inspect without professional monitoring tools?
Yes. Use the instance status and resource information available in the console together with a simple log sheet. Consistent record-keeping will surface most early problems.