
Cloud Phones for Ops Inspection: Batch Checking and Anomaly Records
The Hard Part of Inspection Is Coverage, Not Method
Most teams already have their inspection steps written down: check whether the service port responds, whether the homepage opens, whether login works, whether the logs show errors. Doing it once takes a few minutes — but multiply that by dozens of environments and by the number of runs per day, and it becomes a heavy burden. The more people involved, the looser the standard; the looser the standard, the more anomaly records turn into “whatever the on-call engineer happened to think”.
The mobile side is even trickier. Whether the app's first screen loads, whether a push notification arrives, whether mini-program authorization works — these can only be verified on a real device. Server-side health checks simply cannot cover them.
What Role Cloud Phones Play in Inspection
A cloud phone is essentially an Android device running in the cloud, operated through a browser or an API. There is no hardware to buy and nobody has to watch it charge. In an inspection context, it solves three things:
Consistent environments. Model, OS version and network egress are all managed by the platform, so you never get the “it opens on my phone but not on yours” argument.
Batch operation. Multiple devices can run the same action at the same moment, instead of someone tapping through them one by one.
Traceable process. Screenshots, logs and timestamps from every step are preserved, so when something breaks you can go back to the scene.
A Four-Step Approach to Batch Checking
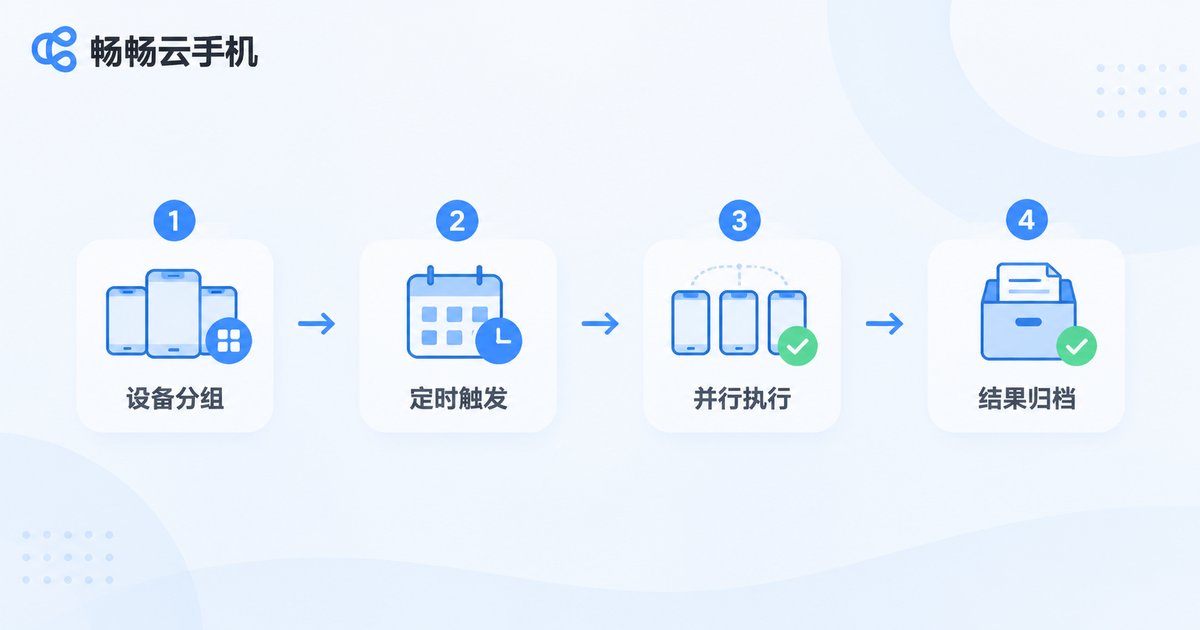
Step one: group your inspection targets. Split them by business line, region or app version, and map each group to a set of cloud phone instances. Grouping matters because when something fails you can immediately tell which kind of environment is affected instead of re-checking everything.
Step two: turn the steps into a template. Keep only criteria that can actually be judged — for example, “the core homepage element appears within 5 seconds of opening” or “after login the user lands on the workspace page”. Vague descriptions cannot go into a template, and that alone forces the team to agree on one standard.
Step three: schedule and run in parallel. Trigger a run automatically at fixed times and let it produce a summary. People only need to read the conclusion.
Step four: archive the results. Each run produces a record with pass count, fail count, failure details and the matching screenshots.
Here is a simplified task configuration used to illustrate the idea (please refer to your platform's own documentation for real field names):
task: daily_inspection
targets:
  - group: 'app-frontend'
    devices: 10
    steps:
      - open: 'https://m.example.com'
      - wait: '5s'
      - assert_element: 'home_banner'
  - group: 'mini-program'
    devices: 5
    steps:
      - open: 'mp-login-page'
      - assert_text: 'login succeeded'
on_failure:
  - screenshot: true
  - record: 'device_id, group, step, timestamp'
Checklist: Define the Criteria First, Then the Frequency
What matters is not how many items you inspect, but whether each item answers the question “what counts as a failure”. Here is a list you can use as a starting point:
| Check item | Pass criteria | Suggested frequency | What to do on failure |
|---|---|---|---|
| App cold start | Time from tapping the icon to an interactive homepage | Twice a day | Screenshot and log the duration |
| Login chain | A full login can be completed | Hourly | Auto retry once, then alert |
| Core page elements | Key controls appear on time | Every 30 minutes | Keep the page screenshot |
| Public network access | The device can reach the internet | Hourly | Record the failing device ID |
| Version consistency | Installed build matches the expected version | Once a day | Flag it and push the update |
Do not start with a very dense schedule. Get it working first, then increase frequency, otherwise alert noise will drown out the real problems.
Writing Anomaly Records People Can Actually Find Later
Many teams end up with records that just say “system X was down” — no device, no time, no step — and a post-mortem turns into a memory exercise. A usable anomaly record needs at least four things: which device, which step it failed at, the on-screen screenshot, and a timestamp accurate to the second.
Two more fields make it much better: the network status at the time, and whether other devices in the same batch also failed. The first separates environment problems from business problems; the second separates a single-device fault from a global one.
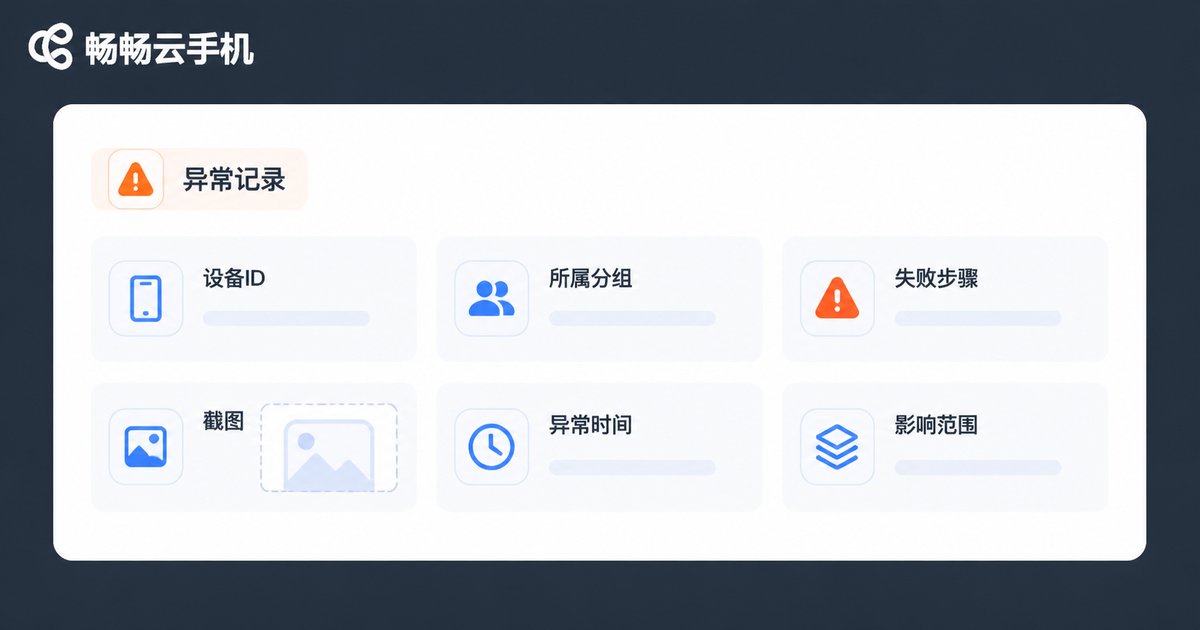
For archiving, build a directory structure of “group + step + date” so records stay searchable. That way, if a page fails for three days straight in one region, you can see it by browsing the archive instead of re-running everything to find out.
Building the Inspection Environment with ccloudphone
Moving inspection onto cloud phones brings two immediate benefits. First, device count scales on demand — add a few instances before a major campaign and scale back after the peak. Second, the environment is maintained by the platform, so it is not constrained by your office network or local device models, and the on-call engineer can run exactly the same checks from home.
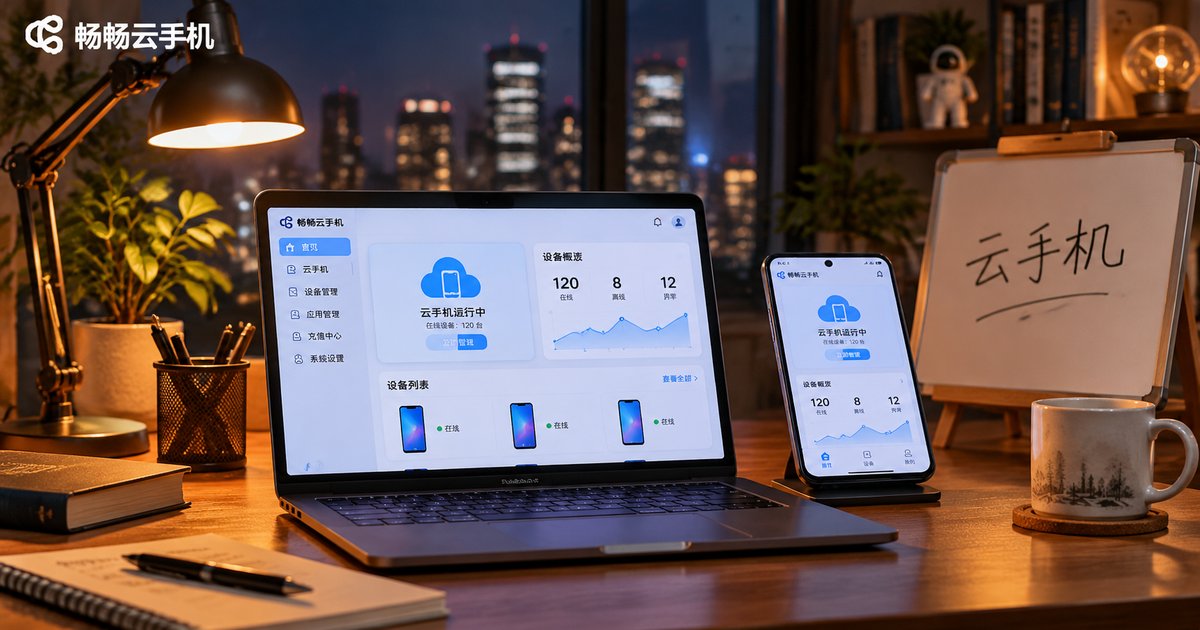
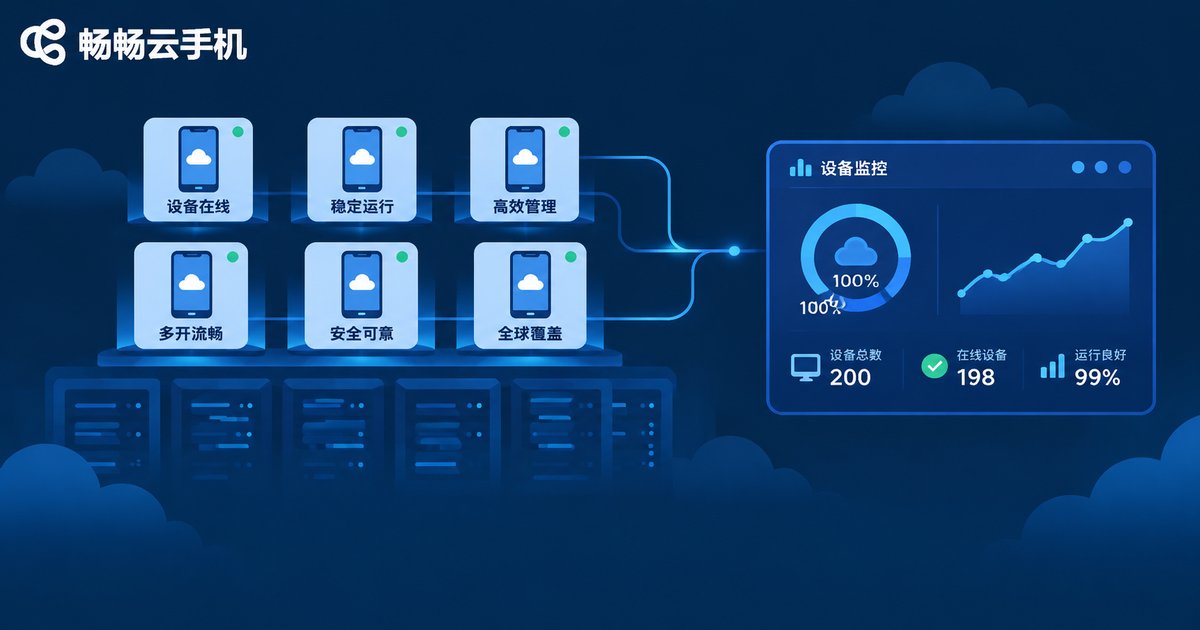
ccloudphone provides cloud-based Android instances that can be operated directly in a browser, with multi-device management and batch operations, making it a stable carrier for routine inspection. A practical rollout is to start with one small group and run the full loop once — grouping, templates, scheduling and archiving — confirming that anomaly records are genuinely searchable and reviewable before onboarding other business lines.
A Suggested Rollout Pace
Week one: pick your most stable business line, use 5 to 10 devices, and run only 2 to 3 key check items. Focus on proving that the template and the screenshots are usable.
Week two: lock down the anomaly record fields, start archiving by directory, and get the on-call team used to reading summaries instead of tapping through devices.
From week three: expand groups and check items gradually, and remove any item that keeps producing false alarms — a chronically false-positive check is worse than no check at all.
FAQ
Q: Do we have to use cloud phones for inspection?
No. Keep your existing server-side health checks as they are. Cloud phones fill the gap of “does it actually work on a real device”, so the two are complementary.
Q: How many cloud phones do we need at the start?
Start with 5 to 10 instances covering one or two key groups. Once results are stable, expand group by group along business lines.
Q: Will batch inspection generate a lot of false alarms?
Yes, and it is the most common problem. Control it in two ways: write criteria specific enough to be judged, and set automatic retries for intermittent failures so only repeated failures trigger an alert.
Q: Can cloud phone inspection cover things server health checks cannot?
Yes — first-screen rendering, the timing of page element appearance, login redirect chains and installed build versions are all things only the device side can verify.
Q: How should anomaly records be archived for later lookup?
Include at least the device identifier, group, failed step, screenshot and an accurate timestamp, and organize them by “group + step + date”. Only with fixed fields can you compare trends over time.