Cloud Phone Monitoring & Alert Setup Guide: Device Status, Resource Usage, and Anomaly Notifications
Why Cloud Phones Need Monitoring and Alerts
When you operate a handful, dozens, or even hundreds of cloud phones at once, the biggest risk is not slow tasks but devices quietly going offline without you knowing. Idle tasks stop, live streams cut off, automation scripts freeze — the later you discover it, the bigger the loss. Monitoring and alerts turn passively finding problems into actively receiving notifications, so you know right away which device is in trouble.
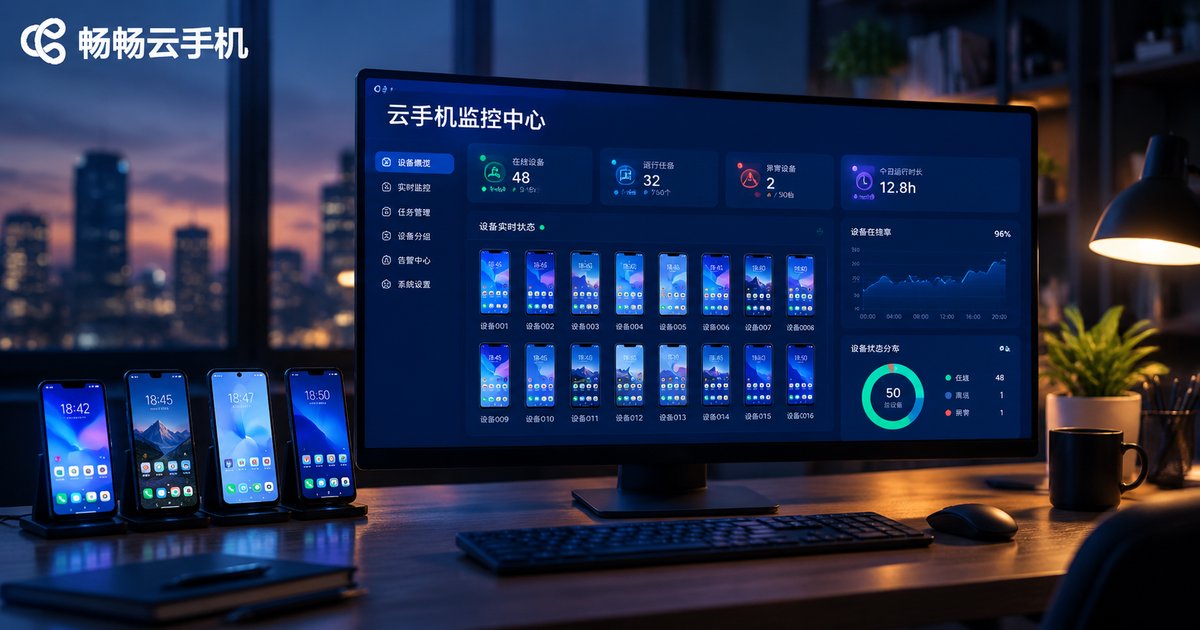
A complete cloud phone monitoring system revolves around three types of information: device status, resource usage, and anomaly events. This guide breaks down each layer with actionable alert configuration tips you can apply today.
Core Metric 1: Device Status
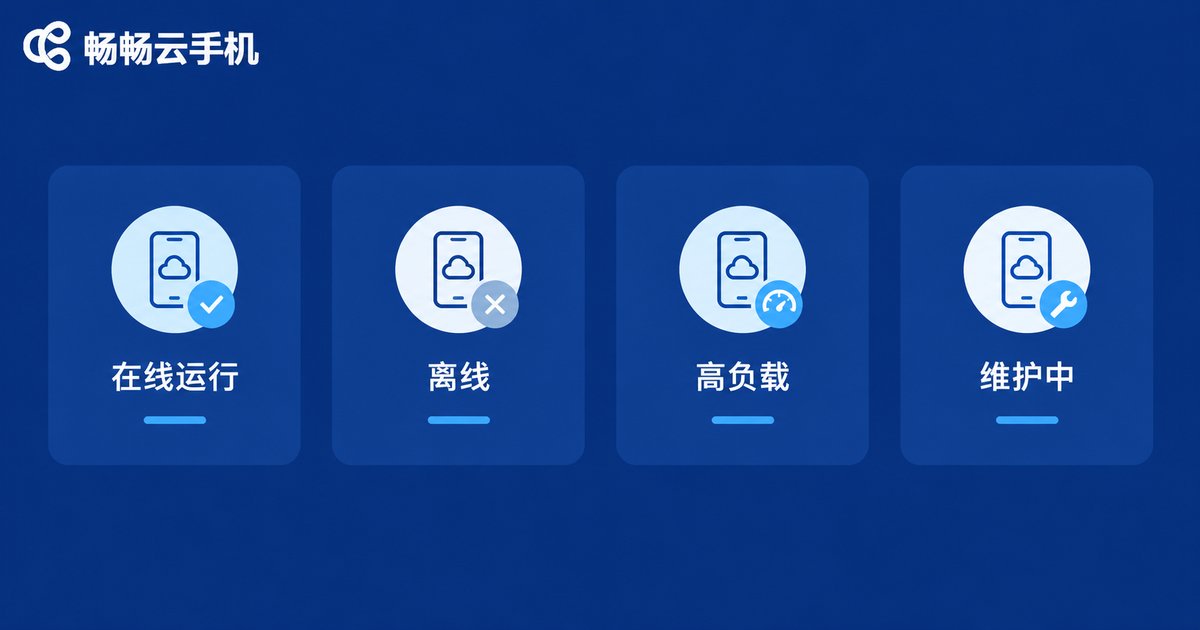
Device status is the foundation of all monitoring. Open the device list in your cloud phone console and first confirm whether each device is online and operable. Common states fall into four categories:
| Status | Meaning | Recommended action |
|---|---|---|
| Online | Device is powered on and remotely operable | No action needed |
| Offline | Device is disconnected or powered off | Check the network, then power on again |
| High load | Noticeable lag and slow response | Inspect CPU and memory usage |
| Maintenance | Platform upgrade or device migration | Wait for automatic recovery |
Two habits are recommended for daily management: inspect the device list at a fixed time every day, and enable offline reminders for critical devices so an outage is never discovered hours later.
Core Metric 2: Resource Usage
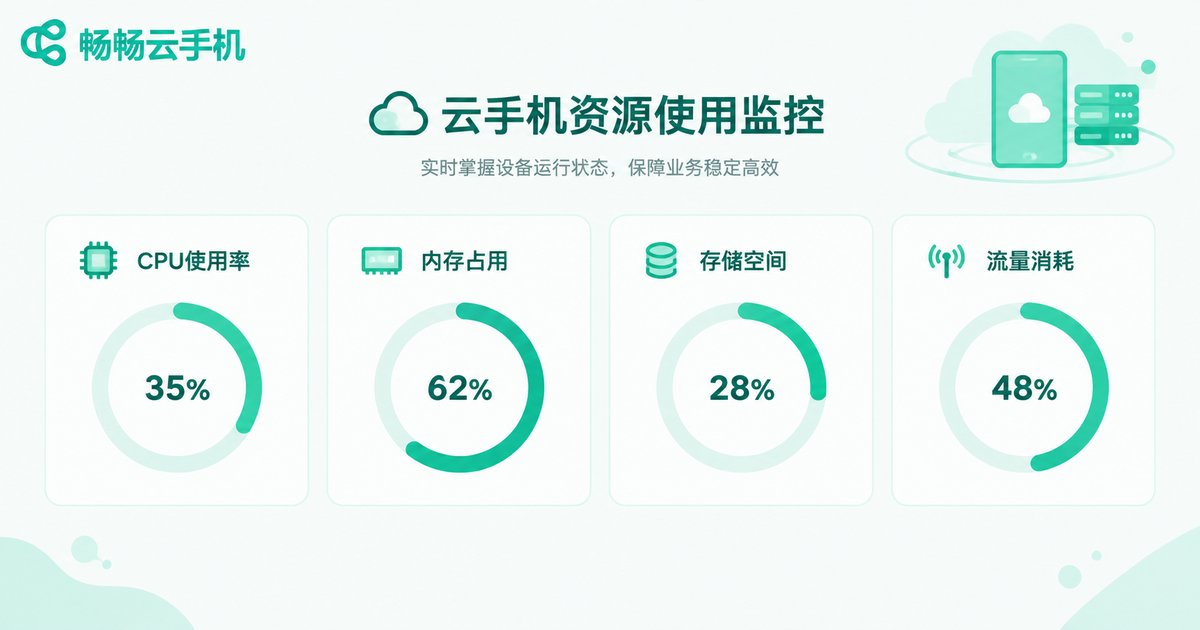
Being online does not mean everything is fine — exhausted resources interrupt tasks just the same. Watch four key resources:
CPU usage: consistently above 80% means tasks are too heavy and lag is likely; reduce concurrent tasks per device or move to a higher configuration.
Memory usage: when memory is near its limit, apps get killed by the system, showing up as crashes and tasks that stop for no reason — the most common hidden risk in idle-running scenarios.
Storage space: installation packages, caches and app data keep piling up; insufficient space prevents app updates or even launches, so clean up regularly.
Data traffic: if your plan is metered or throttled, abnormal traffic spikes usually mean runaway app updates or misbehaving background tasks and deserve close attention.
Core Metric 3: Anomaly Events and Alert Rules
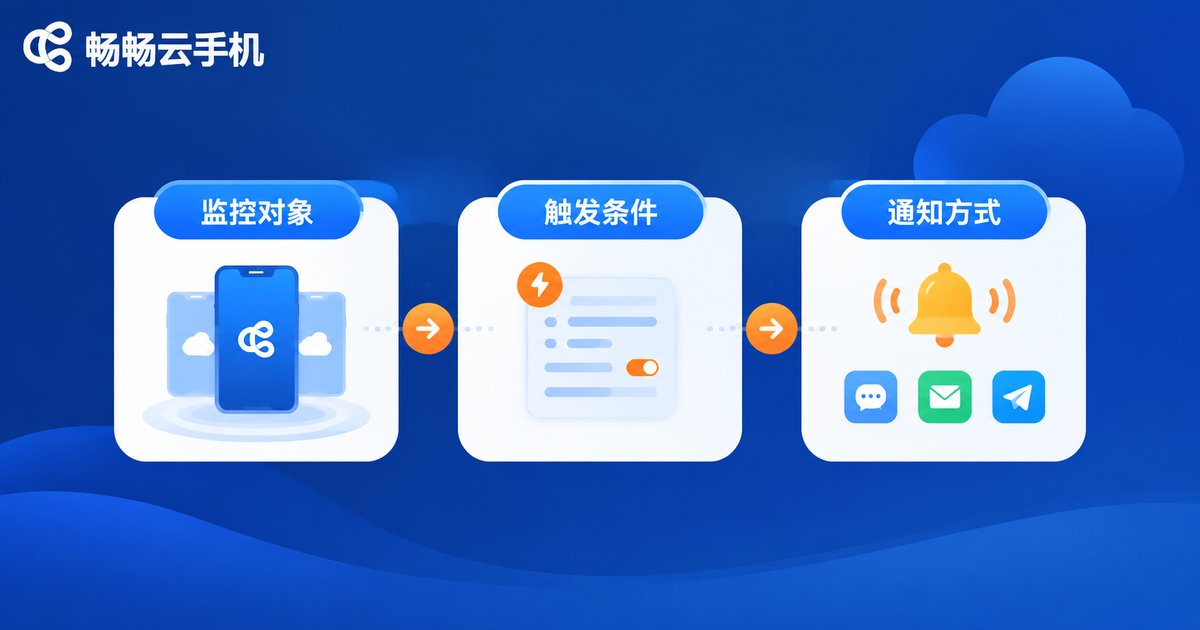
Beyond status and resources, watch for specific anomaly events: devices going offline, app crashes, failed tasks, expired login sessions, and threshold breaches. An alert is essentially a rule for each type of anomaly, built from three parts: monitored target + trigger condition + notification channel.
| Monitored item | Suggested threshold | Why |
|---|---|---|
| Device offline | Offline for more than 5 minutes | Filters false alarms caused by network jitter |
| CPU usage | Above 85% for 10 consecutive minutes | Identifies task overload |
| Memory usage | Above 90% | Prevents app crashes |
| Storage space | Less than 10% remaining | Leaves a buffer for cleanup |
Stack multiple notification channels: in-console messages as a record, WeChat or email for instant reach, and SMS on top for critical devices. The key is that every alert must be followed up by someone — otherwise even the most sensitive alerts are just decoration.
Practical Tips: Making Monitoring Part of Daily Operations
If you are still checking devices one by one, we recommend ChangChang Cloud Phone (ccloudphone). It supports centralized management of multiple cloud phones: you can view the device list and running status right in the console, and with batch power-on and batch operations you can recover devices quickly after an anomaly, greatly shortening troubleshooting time. For long-term idle running and batch operations, centralizing all devices into one panel is itself the most basic and effective monitoring method.
Combine it with three operational habits and your monitoring system is basically in place:
1. Group management: group devices by business and inspect them group by group — far more efficient than random spot checks.
2. Keep an anomaly log: briefly note the time, device and cause of every alert; patterns will emerge over time, such as a certain task always dropping in the middle of the night.
3. Review thresholds regularly: as workloads change, old thresholds may no longer fit. Review alert records monthly, loosen rules that over-report, and add coverage for scenarios that slip through.
FAQ
Q: What should I do when a cloud phone goes offline?
Check your local network first, then reboot the device from the console. If it disconnects frequently, contact ChangChang Cloud Phone (ccloudphone) support, and also check whether too many tasks on a single device are making it unstable.
Q: How should alert thresholds be set?
There is no universal answer. Start loose: set permissive thresholds first, observe normal levels for a week or two, then tighten gradually until alerts catch real anomalies without flooding you with noise.
Q: How many devices justify monitoring and alerts?
Even one or two devices are worth it, because idle-running workloads are unattended by nature. The more devices you have, the greater the benefit — above 10 devices it is essentially a must-have.
Q: What if resource usage stays high?
Check for too many resident apps, clear caches and remove unused apps. If the workload on one device is genuinely heavy, upgrade the device configuration or split tasks across multiple devices.