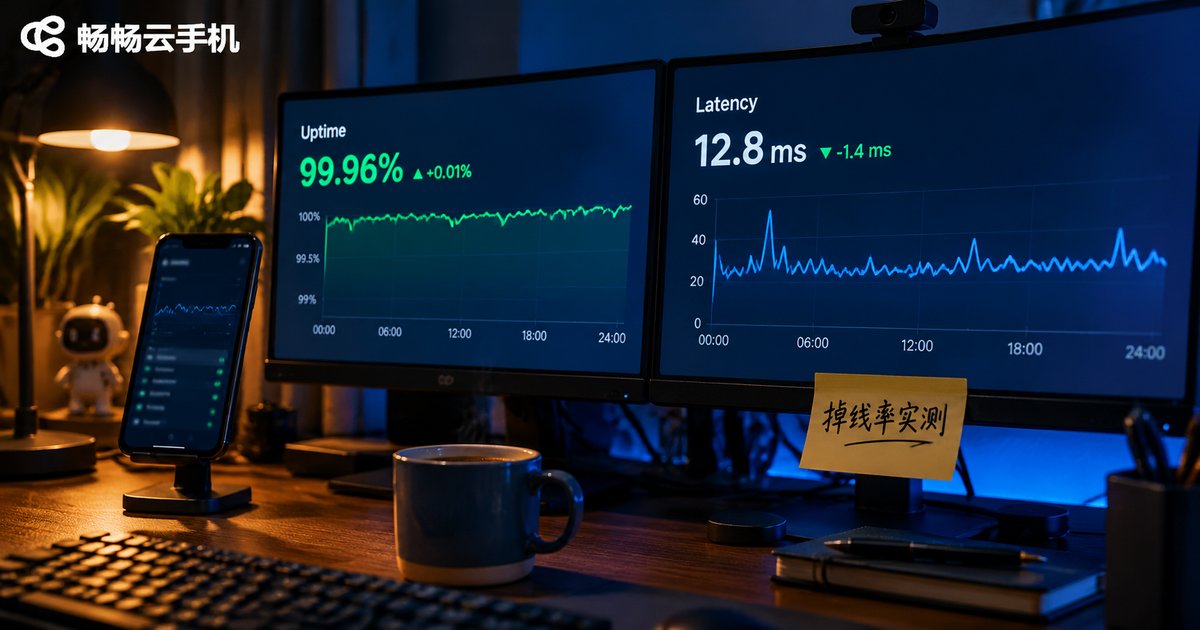

Cloud Phone Group Control Monitoring: Online Rate, CPU & Script Progress Dashboard Guide
The Bigger Your Fleet, the More Group Control Needs Status Monitoring
With three or five cloud phones, one glance tells you which device dropped or which script is stuck. At 50, 100 or more instances, manual watching stops working: a device silently disconnects overnight, a script halts halfway, and by the time you notice the next morning, hours of work are already lost.
Group control means driving many devices with one workflow — and monitoring is that workflow's eyes. A good dashboard answers three questions at a glance: Is everything online? Are the machines overloaded? Is the work getting done? Those map exactly to three core metrics: online rate, CPU usage, and script progress.
Core Metric #1: Online Rate — the Lifeline of Group Control
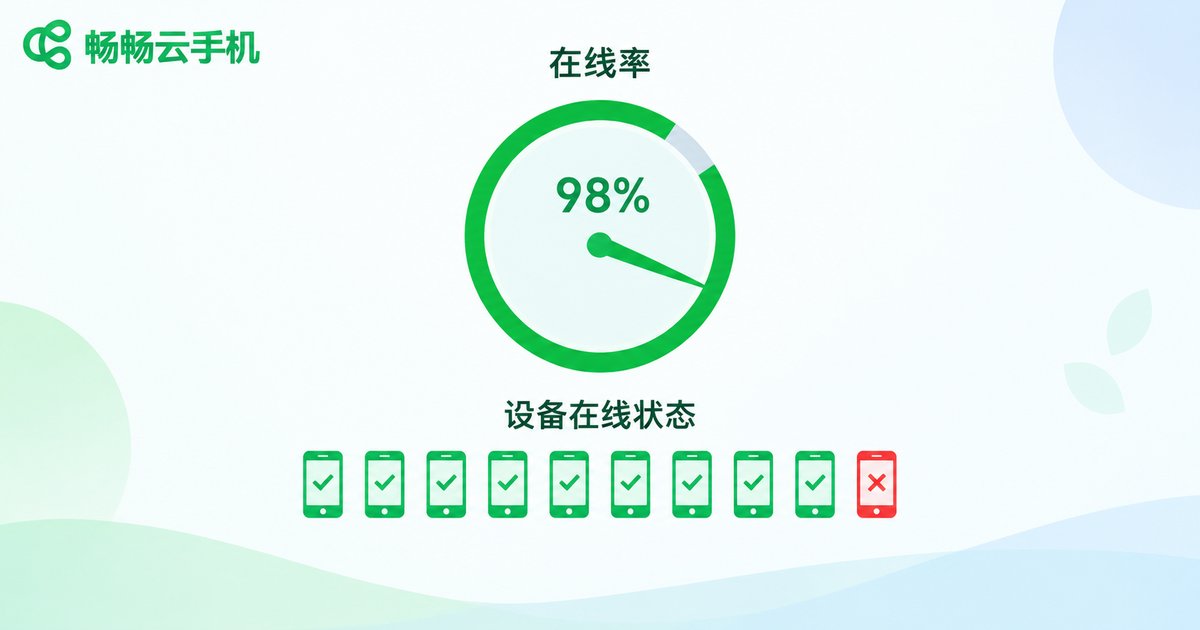
Online rate = devices currently online ÷ total devices that should be online × 100%. Run 100 cloud phones with 98 connected, and your online rate is 98%.
Never underestimate this number — it is the precondition for everything: when a device is offline, even the best script is useless. Put it in the most prominent spot on your dashboard, as a big number or a gauge.
Reference health ranges:
| Online rate | Status | Suggested action |
|---|---|---|
| ≥ 98% | Healthy | Routine checks only |
| 95% – 98% | Needs attention | Investigate why devices drop |
| < 95% | Abnormal | Batch restart or reconnect immediately |
Keep the definition consistent: does "online" mean connectable, or actually running scripts? Track both — a "connection online rate" reflects device status, while a "task online rate" reflects real usability. The second is usually lower, and far more honest.
Core Metric #2: CPU Usage — an Early Warning for Lag and Dropouts
CPU usage shows the load on each device. A cloud phone is a virtual Android device running on a server; when its CPU saturates, the symptoms are slower scripts, laggy rendering, and eventually disconnections.
Watch two dimensions at once:
1. Per-device CPU: a single device stuck above 85% usually means its script is too heavy or caught in a loop — handle it individually.
2. Fleet-wide average: if the average keeps climbing, your schedule is too dense — reduce the load or add capacity.
Practical tip: read the trend, not the instant value. Plot CPU samples every 5 minutes. Healthy tasks draw a gentle wave; a line that flattens at a high level almost always means a script has frozen.
Core Metric #3: Script Progress — Is the Work Actually Getting Done?
The first two metrics tell you whether devices are fine; script progress tells you whether the job is done. Classify every device's task by state:
| Task state | Meaning | What to watch |
|---|---|---|
| Running | Script executing | Count should stay stable |
| Queued | Waiting for a slot or a previous task | A growing queue means too little concurrency |
| Completed | Finished normally | Cumulative completions are your core output |
| Failed / interrupted | Errored or cut off | Investigate once the failure rate passes 5% |
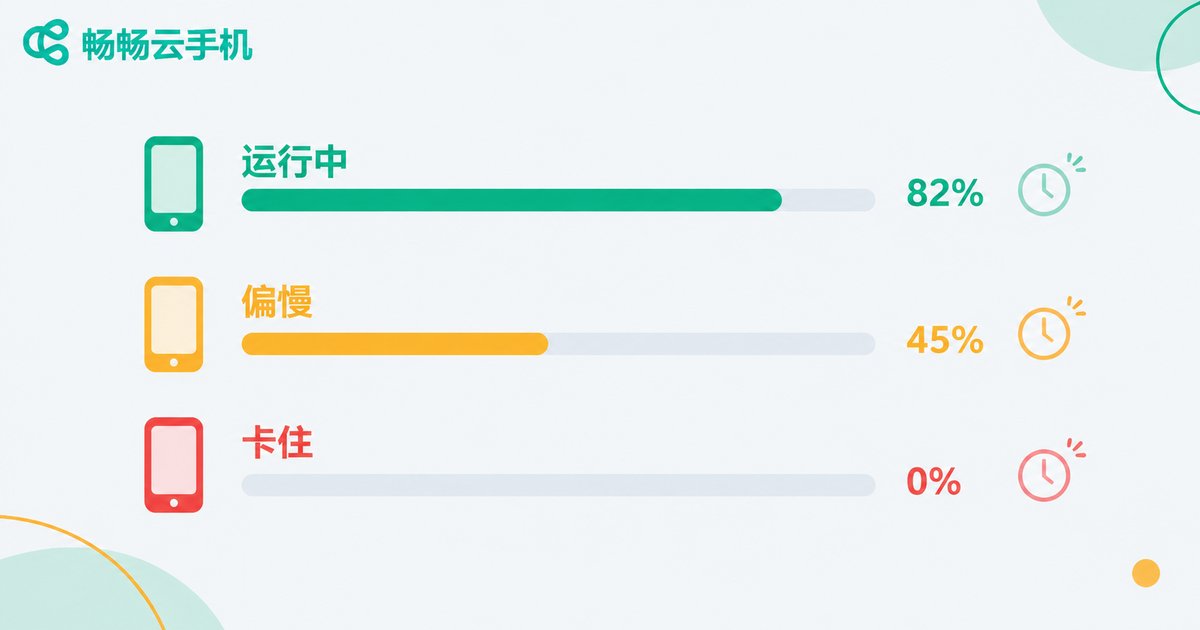
Beyond state counts, track progress percentage and average duration. If a task that normally takes 20 minutes suddenly averages 40, something is wrong even without errors — likely device lag or network jitter. Color-coded progress bars (green = normal, yellow = slow, red = stuck) let you spot problem devices instantly.
Supporting Metrics You Shouldn't Ignore
Beyond the three core metrics, these supporting signals complete your monitoring system:
| Metric | What to watch | Warning sign |
|---|---|---|
| Memory usage | Per-device RAM | Sustained > 90% invites background-app kills |
| Storage | Free space | Below 10%, installs and caching start failing |
| Network traffic | Up/down rate | Traffic at zero while "online" = fake online |
| Unexpected restarts | Restart count per period | Frequent restarts mean an unstable environment |
Beware of "fake online": the device shows connected, but traffic is zero and the script hasn't moved — it has effectively stopped working. Reading traffic together with script progress exposes these cases immediately.
Build the Dashboard in Three Steps: Collect, Aggregate, Visualize
Step 1 — Collect. Pull device status on a schedule: online state, CPU, memory, and task progress every 1–5 minutes. A simple script does the job:
# Pseudo-code: collect device status every minute
import time

def collect_once():
    # Fetch the device list from your group-control backend
    devices = get_device_list()
    report = []
    for d in devices:
        report.append({
            'id': d['id'],
            'online': d['status'] == 'online',
            'cpu': d['cpu_percent'],
            'task_progress': d['task']['progress'],
            'task_state': d['task']['state'],
        })
    save_to_database(report)   # write to a database or time-series store

while True:
    collect_once()
    time.sleep(60)
Step 2 — Aggregate. Raw data is per-device detail; the dashboard needs fleet-level numbers: online rate, average CPU, task counts by state, failure rate. Design two layers — an overview for the big picture, plus groups (by business line or batch) to locate which batch has the problem.
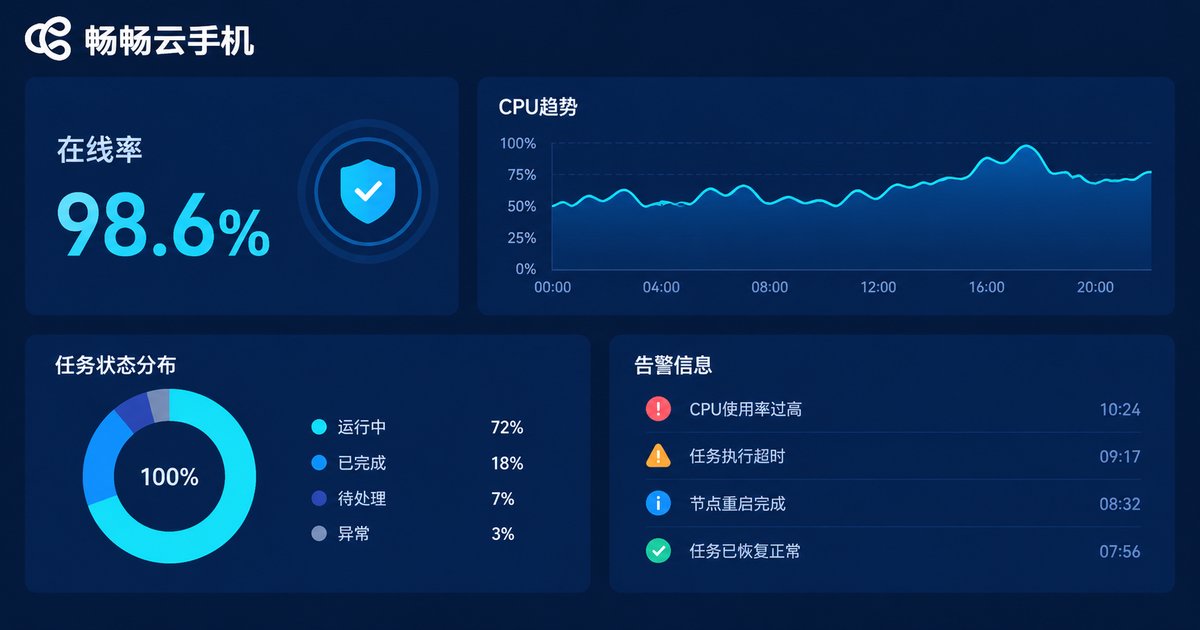
Step 3 — Visualize and alert. A practical dashboard includes these modules:
| Module | Chart type | Purpose |
|---|---|---|
| Online-rate big number | Stat card / gauge | Confirm device survival at a glance |
| CPU trend | Line chart (average + peak) | Catch rising load and frozen scripts |
| Task state mix | Donut / stacked bars | Track overall task progress |
| Problem device list | Sortable table | Hands you an action list directly |
| 24-hour online curve | Area chart | Review which hours tend to drop |
Start with just three alert rules: online rate below 95%, any device above 85% CPU for 30 minutes, task failure rate above 5%. Deliver alerts through the channel you actually read — chat-bot push, SMS, or a phone call — so problems reach you within minutes, not the next morning.

Pick the Right Cloud Phone and Monitoring Gets Much Easier
A dashboard makes problems visible; stable devices make them rare. If your workload means long-term multi-instance operation and batch scripting, evaluate cloud phones on three points: device online stability, batch management capability, and smooth group-control operations.
ccloudphone is built for exactly these multi-instance, group-control scenarios, with unified device management and batch operations as baseline capabilities. Combined with the monitoring approach in this article, day-to-day maintenance cost drops sharply: when the device layer is stable, your online-rate curve stays flat, and you only glance at the dashboard occasionally while focusing on scripts and business logic.
Visit the ccloudphone official website to learn more — start small, get the collect–dashboard–alert loop running, then scale up.
FAQ
Q: Can I build a monitoring dashboard without coding skills?
Yes. The simplest version is a spreadsheet: export the device list on a schedule, compute online rate and failure rate with formulas, and highlight anomalies with conditional formatting. It is not real-time, but it works for small fleets. Move to scripted collection plus a visual panel as you scale.
Q: What online rate counts as normal?
For steady long-running workloads, 98% or higher is ideal. Between 95% and 98%, investigate the causes of drops. Below 95% suggests a systemic issue — network instability, service trouble, or an overloaded schedule — and needs prompt action.
Q: How high is CPU too high?
Watch any single device sustained above 85% — it may hold a stuck loop or an overly heavy task. If the fleet average stays above 70%, your concurrency plan is too dense; stagger tasks or add devices. Brief spikes are normal — trends matter more than instant values.
Q: Script progress is frozen but the device shows online — what now?
That is classic "fake online": the connection lives, the script does not. Check that device's CPU — if it is zero or erratic, the script has hung; restart the device and rerun the task. Also review the script for unhandled popups or element-wait timeouts.
Q: How often should I sample monitoring data?
Online state every 1–3 minutes, CPU and memory every 1–5 minutes, and script progress at each key milestone of the task. Sampling too often adds overhead; too rarely misses short anomalies. For most workloads, once a minute is a good balance.