
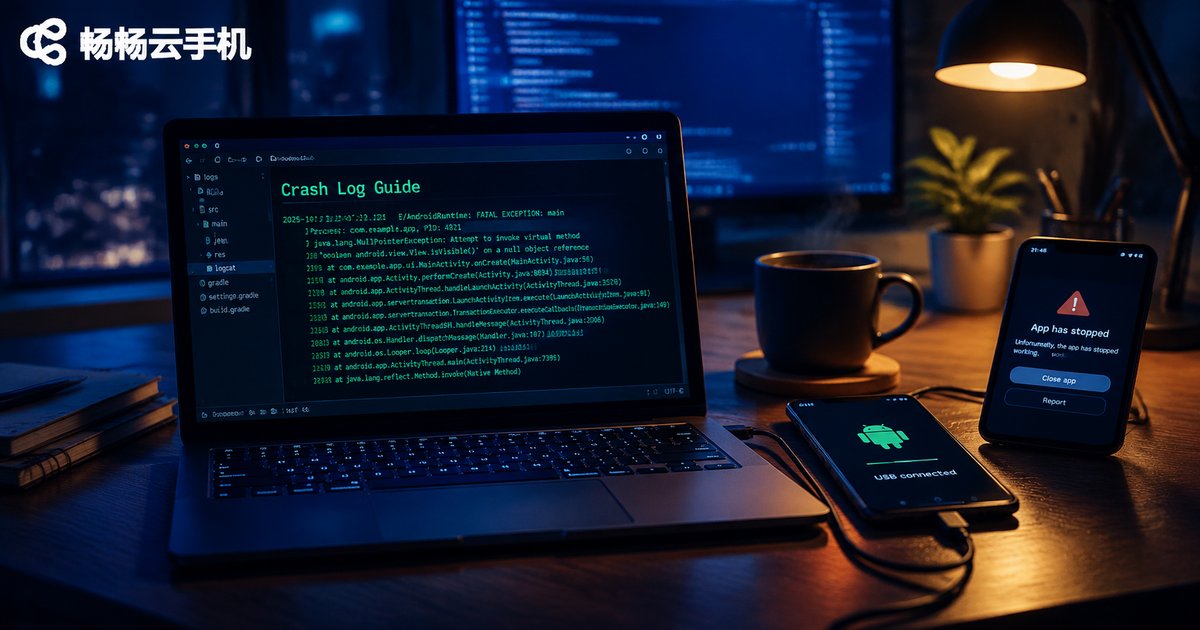
How to Export Cloud Phone Crash Logs: From Logcat Filtering to Stack Analysis
Why Crash Logs Are the First Crime Scene
When you run game multi-boxing, app testing, or automation scripts on a cloud phone, nothing is more frustrating than an unexplained crash. Rebooting the instance, reinstalling the app, switching devices... the symptom may disappear for a while, but the root cause remains. The only decisive evidence lives in the crash log.
A crash log records the final call trail before a process dies: which thread failed, what exception was thrown, and where the code stopped. Mastering the full chain of 'export logs → filter and locate → analyze the stack' turns mysterious crashes into reproducible, explainable technical problems. This guide walks through the entire workflow with the standard Android ADB toolchain.
Where Crash Logs Live: Three Key Locations
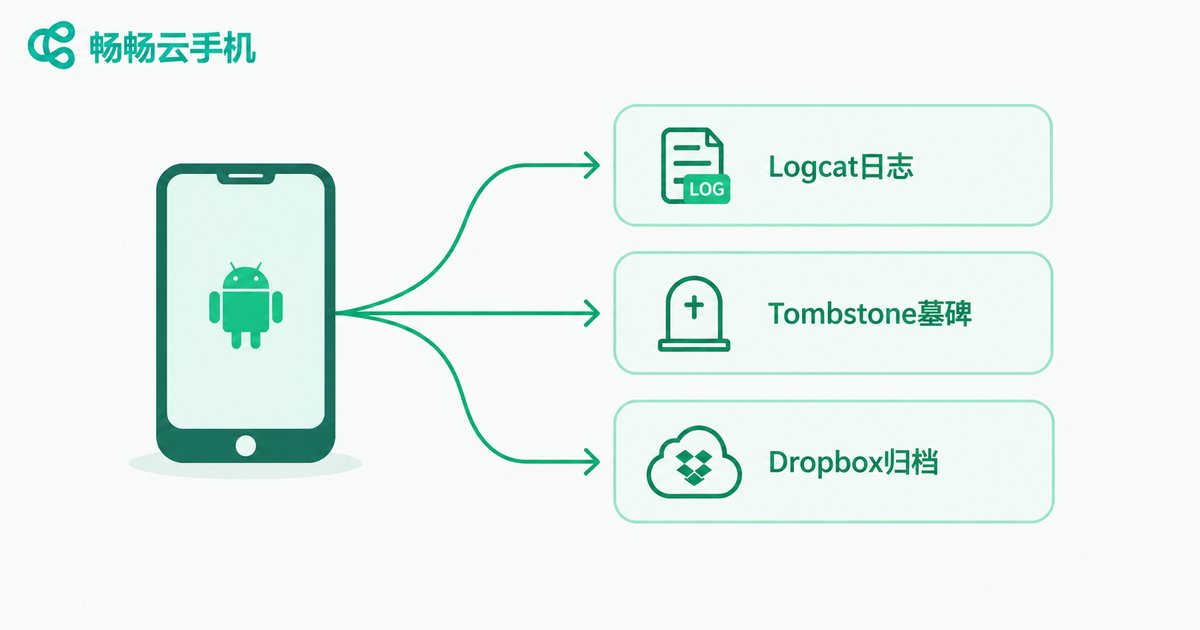
Android writes crash information to three different places. Know where to look before you start:
1. The Logcat buffer. An in-memory ring buffer of log streams, split into main, system, and crash buffers. The crash buffer collects crash records specifically and is the most common first stop. The downside: capacity is limited, so older entries may already have been rolled over by newer logs.
2. The /data/tombstones directory. Native crashes (problems in C/C++ .so libraries) generate 'tombstone' files here, recording the signal type, registers, and a full backtrace — more complete than Logcat.
3. The /data/system/dropbox directory. A system-level archive of anomalies: ANRs, app crashes, and system service errors all leave records here, ideal for tracing historical issues.
Method 1: One-Line Export of the Crash Buffer
The most frequently used command:
# Dump the crash buffer to a file (-d exits right after dumping)
adb logcat -b crash -d -v time > crash.log
Parameters: -b crash reads only the crash buffer; -d dumps the current buffer and exits instead of streaming; -v time adds timestamps so you can align logs with your reproduction steps. To also capture system-level errors:
adb logcat -d -v time *:E > error.logMethod 2: Full Package with bugreport
For complex issues that need a complete snapshot, bugreport bundles the device's logs, tombstones, dropbox entries, and dumpsys state into one file:
adb bugreport bugreport.zipThe archive contains FS/data/tombstones, dumpsys output, event logs and more — the standard material when handing the issue to developers or support. The tradeoff is time: it can take several minutes on low-end devices.
Method 3: Reading Tombstones and Dropbox Directly (A Cloud Phone Advantage)
On physical phones, reading these directories usually requires root — while most cloud phone instances ship with root and ADB enabled, which is a natural advantage for crash analysis:
# List native crash tombstone files
adb shell ls /data/tombstones/
adb pull /data/tombstones/tombstone_00 .

# Export the dropbox archive of historical anomalies
adb shell dumpsys dropbox --print > dropbox.log
Tombstone files record the signal type (e.g., SIGSEGV), fault address, and native backtrace at crash time, which can be mapped back to specific functions with a symbolized .so file.
Logcat Filtering: Pinpointing the Crash in Millions of Lines
Full logs can easily reach hundreds of thousands of lines. Narrow them down with this four-layer funnel:
Layer 1: filter by process. Get the target app's PID and watch only its own logs:
adb shell pidof com.example.game
adb logcat -v time --pid=12345 *:E > app_error.log
Layer 2: filter by level. *:E outputs Error and above only, cutting noise by ninety percent.
Layer 3: filter by tag. If you know the component involved, use -s to specify tags:
adb logcat -d -s ActivityManager:E AndroidRuntime:ELayer 4: keyword sweep. Java crashes always contain the keyword FATAL — just grep for it:
adb logcat -d | grep -iE 'FATAL|beginning of crash'
Stack Analysis in Four Steps: Understanding What the Crash Says
A typical Java crash looks like this:
FATAL EXCEPTION: main
Process: com.example.game, PID: 12345
java.lang.NullPointerException: Attempt to invoke virtual method on a null object reference
    at com.example.game.MainActivity.onCreate(MainActivity.java:42)
    at android.app.Activity.performCreate(Activity.java:8051)
Read it in four steps:
Step 1: locate the FATAL EXCEPTION block and confirm the crashing process and PID, ruling out a chain reaction from another app.
Step 2: read the exception type and message. NullPointerException means a null reference; ClassCastException means a bad cast; OutOfMemoryError means memory is exhausted — the type alone points to a whole family of causes.
Step 3: scan from top down for the first stack frame in your own package. The stack unwinds from the crash point; the topmost line at com.example.game.MainActivity.onCreate(MainActivity.java:42) is the crime scene: line 42 of MainActivity.
Step 4: cross-check the timeline. Pull the logs around the crash time (memory reclaim, network switches, Activity lifecycle) and reconstruct the trigger conditions.
Native crashes read differently: check the signal type in the tombstone first (SIGSEGV segmentation fault and SIGABRT abort are the most common), then symbolize the backtrace addresses with ndk-stack and a symbolized .so file:
adb logcat -b crash -d | ndk-stack -sym ./libs/arm64-v8a/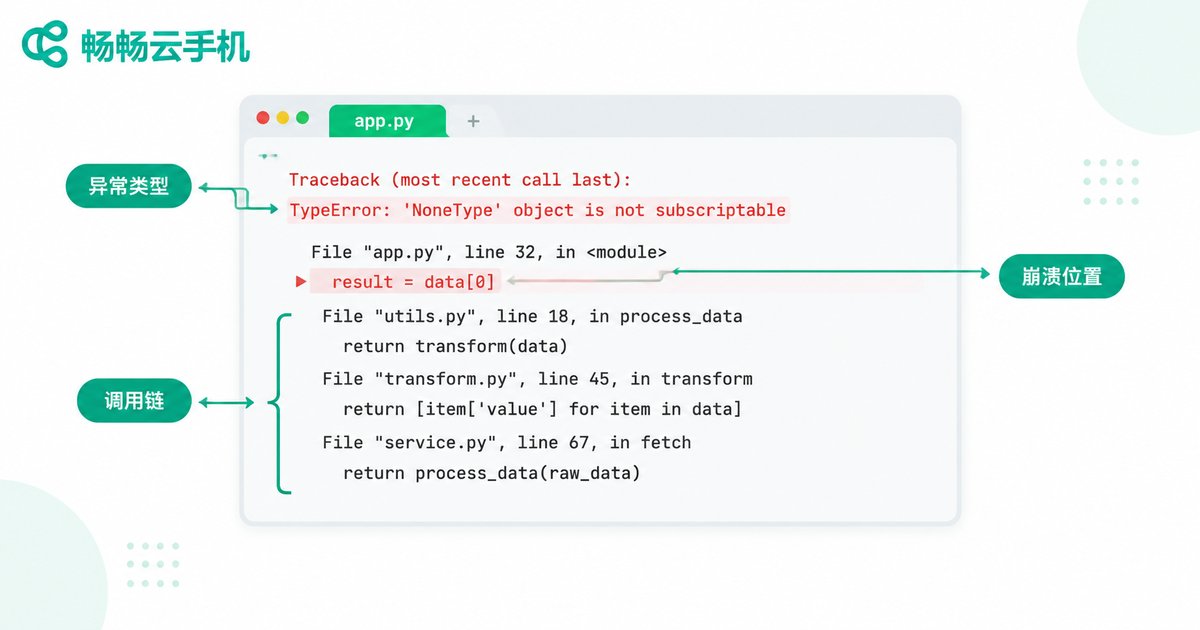
Quick Reference: Common Crash Types
| Crash Type | Log Signature | Typical Cause |
|---|---|---|
| Null pointer | NullPointerException | Object used before initialization |
| Out of memory | OutOfMemoryError | Memory leaks, oversized bitmaps or caches |
| App not responding | ANR / Input dispatching timed out | Main thread blocked for over 5 seconds |
| Native crash | SIGSEGV / SIGABRT + tombstone | Defective .so library, out-of-bounds memory access |
| Environment conflict | Signature or emulator-detection logs | App validates its runtime environment |
Cloud Phone Caveats for Crash Analysis
A cloud phone is essentially a real Android instance running on ARM servers — the logging chain is identical to a physical device — but keep a few differences in mind:
1. Export first, reset later. Resetting or recreating an instance wipes the data partition, taking tombstones and dropbox records with it. Make 'dump immediately after a crash' a habit.
2. Logs roll over. After long uptime, the crash buffer may already be overwritten. For serious investigations, export right after reproduction, or run adb logcat without -d to stream logs to a file continuously.
3. Reproduce across multiple instances. Crashes often depend on specific trigger conditions, and retrying on a single instance is slow. This is where cloud phones shine — ChangChang Cloud Phone (ccloudphone), for example, supports running many instances simultaneously with batch management, so you can launch several instances with different parameter combinations, quickly narrow down the trigger, and then pull logs from the affected instance for deeper analysis.
4. Check the environment itself. If every instance and every app crashes at the same moment, check instance resource usage and network health first rather than the app.

FAQ
Q: Can I export crash logs on a cloud phone without root?
Yes. adb logcat -b crash -d and adb bugreport both work without root; only reading /data/tombstones directly requires it. Most cloud phones enable ADB and root by default, so restrictions are actually fewer than on physical devices.
Q: My crash.log is empty — why?
The buffer has most likely been rolled over, or the crash happened long ago. Reproduce the crash and export immediately; alternatively run adb logcat without -d to stream logs to a file in real time while you reproduce.
Q: The native crash log is full of memory addresses I can't read.
Addresses need symbolication. Use ndk-stack or addr2line with a symbolized .so file matching the crashing build to translate addresses into function names and line numbers.
Q: Is an ANR the same as a crash?
No. A crash means the process exited abnormally; an ANR means the app stopped responding (main thread blocked too long) and the system showed a dialog or killed it. ANR evidence lives in trace files under /data/anr/ and in the dropbox archive — adb bugreport captures both.
Q: How do I batch-export logs from dozens of cloud phone instances?
Write a simple loop script: adb connect to each instance → adb logcat -b crash -d to export → save with the instance ID in the filename. Paired with a cloud phone that supports batch management (such as ChangChang Cloud Phone), you can reproduce across many instances and collect every crash scene in one pass.