
Can You Debug on a Cloud Phone? Understanding Debug Interfaces\n\nMany developers and advanced users using ChangChang Cloud Phone ask a key question: "Can I use ADB debugging?" After all, a cloud phone is essentially an Android device running in the cloud — if you can run automation scripts, debug apps, and capture logs on it, the cloud phone becomes more than a gaming device; it's a complete mobile development platform.\n\nThe answer: ChangChang Cloud Phone supports developer options and debug interfaces, but the setup differs from physical phones. Physical phones connect via USB for ADB debugging, while cloud phones have no physical USB port — debugging is done through network ADB or the client's built-in debug channel.\n\n## How to Enable Developer Options\n\n### Method 1: Standard Android Method (Recommended)\n\nLike physical phones, ChangChang Cloud Phone's Android system hides developer options:\n\n1. Open cloud phone "Settings → About Phone"\n2. Find "Build Number" (or "Software Version")\n3. Tap 7 times consecutively\n4. System shows "You are now a developer"\n5. Return to settings main page — "Developer Options" appears\n\n### Method 2: Client Quick Toggle\n\nChangChang Cloud Phone client provides a quick toggle under "Settings → Advanced → Developer Mode" — one-click enable, no need to manually tap build number.\n\n### Developer Options Core Features\n\n| Feature | Description | Use Case |\n|:---|:---|:---|\n| USB Debugging | Allows ADB connection (actually network ADB) | App development, automated testing |\n| Wireless Debugging | Direct ADB over Wi-Fi | Debugging without USB cable |\n| GPU Rendering Analysis | Shows GPU render time | Performance optimization |\n| Layout Bounds | Shows UI layout boundaries | UI debugging |\n| Animation Scale | Adjust animation speed | Speed up dev debugging |\n| Background Process Limit | Limit background process count | Memory stress testing |\n| Stay Awake | Screen doesn't lock while charging | Long debugging sessions |\n| Logger | Enable verbose log output | Troubleshooting |\n\n## ADB Network Debugging: Connecting to Your Cloud Phone\n\n### Getting Connection Info\n\nAfter enabling developer options and USB debugging, get your cloud phone's network ADB address:\n\n1. Check in ChangChang Cloud Phone client "Settings → Advanced → Debug Info"\n2. Note the IP address and port (typically
Operations · Engineering · Trends
How to Register a Cloud Phone Account? Registration Process and Precautions Explained
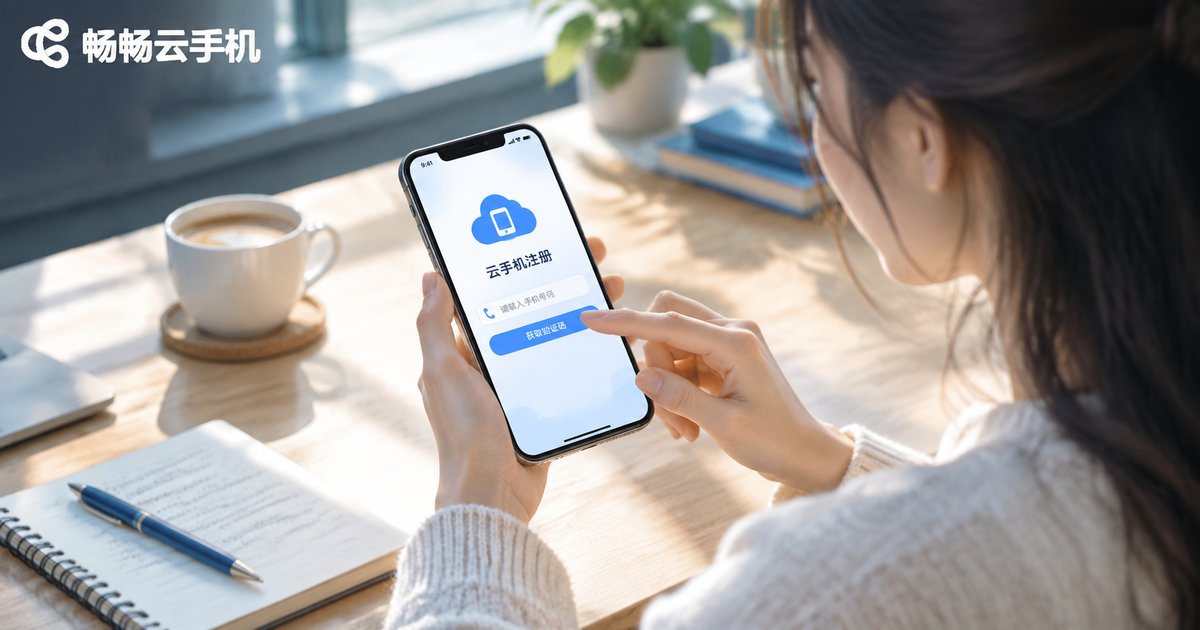
Wondering how to create a cloud phone account? This guide walks you through the entire registration process step by step, from preparing a phone number and a stable network to receiving the SMS verification code and setting a secure password. It also covers essential precautions, such as downloading the app from official channels, protecting your verification code, and following the one-account-per-number rule. A troubleshooting table explains what to do when the code never arrives or the page fails to load. Using ChangChang Cloud Phone (ccloudphone) as an example, this article helps you finish registration in a couple of minutes and start your cloud phone experience with confidence.
Read more
Carrier Cloud Phones vs Third-Party Cloud Phones: How to Choose
Carrier cloud phones and third-party cloud phones may look similar, but they serve very different purposes. Carrier services are add-ons bundled with telecom plans — trustworthy and easy to bill, yet basic in features. Third-party platforms are professional productivity tools offering batch multi-instance management, group control, game idling, and app hosting. This article breaks down the core differences in a single comparison table and helps you decide with three key questions: choose a carrier cloud phone for light backup needs, and choose a professional third-party service such as ChangChang Cloud Phone (ccloudphone) for game idling, multi-account operations, and studio-scale workloads.
Read more
Are Cloud Phones Expensive? Why Some Cost Tens While Others Cost Hundreds per Month
Cloud phone plans can cost anywhere from a few tens to several hundred yuan per month, and the gap comes down to four things: hardware tier, number of instances, dedicated versus shared resources, and value-added features such as group control and multi-instance management. This guide breaks down how cloud phone pricing actually works, compares what budget and premium tiers can realistically do, and shares practical tips on matching a plan to your real needs—start small, trial first, and upgrade on demand—so you pay for performance you will actually use instead of specs that only look good on paper.
Read more